Job Monitoring
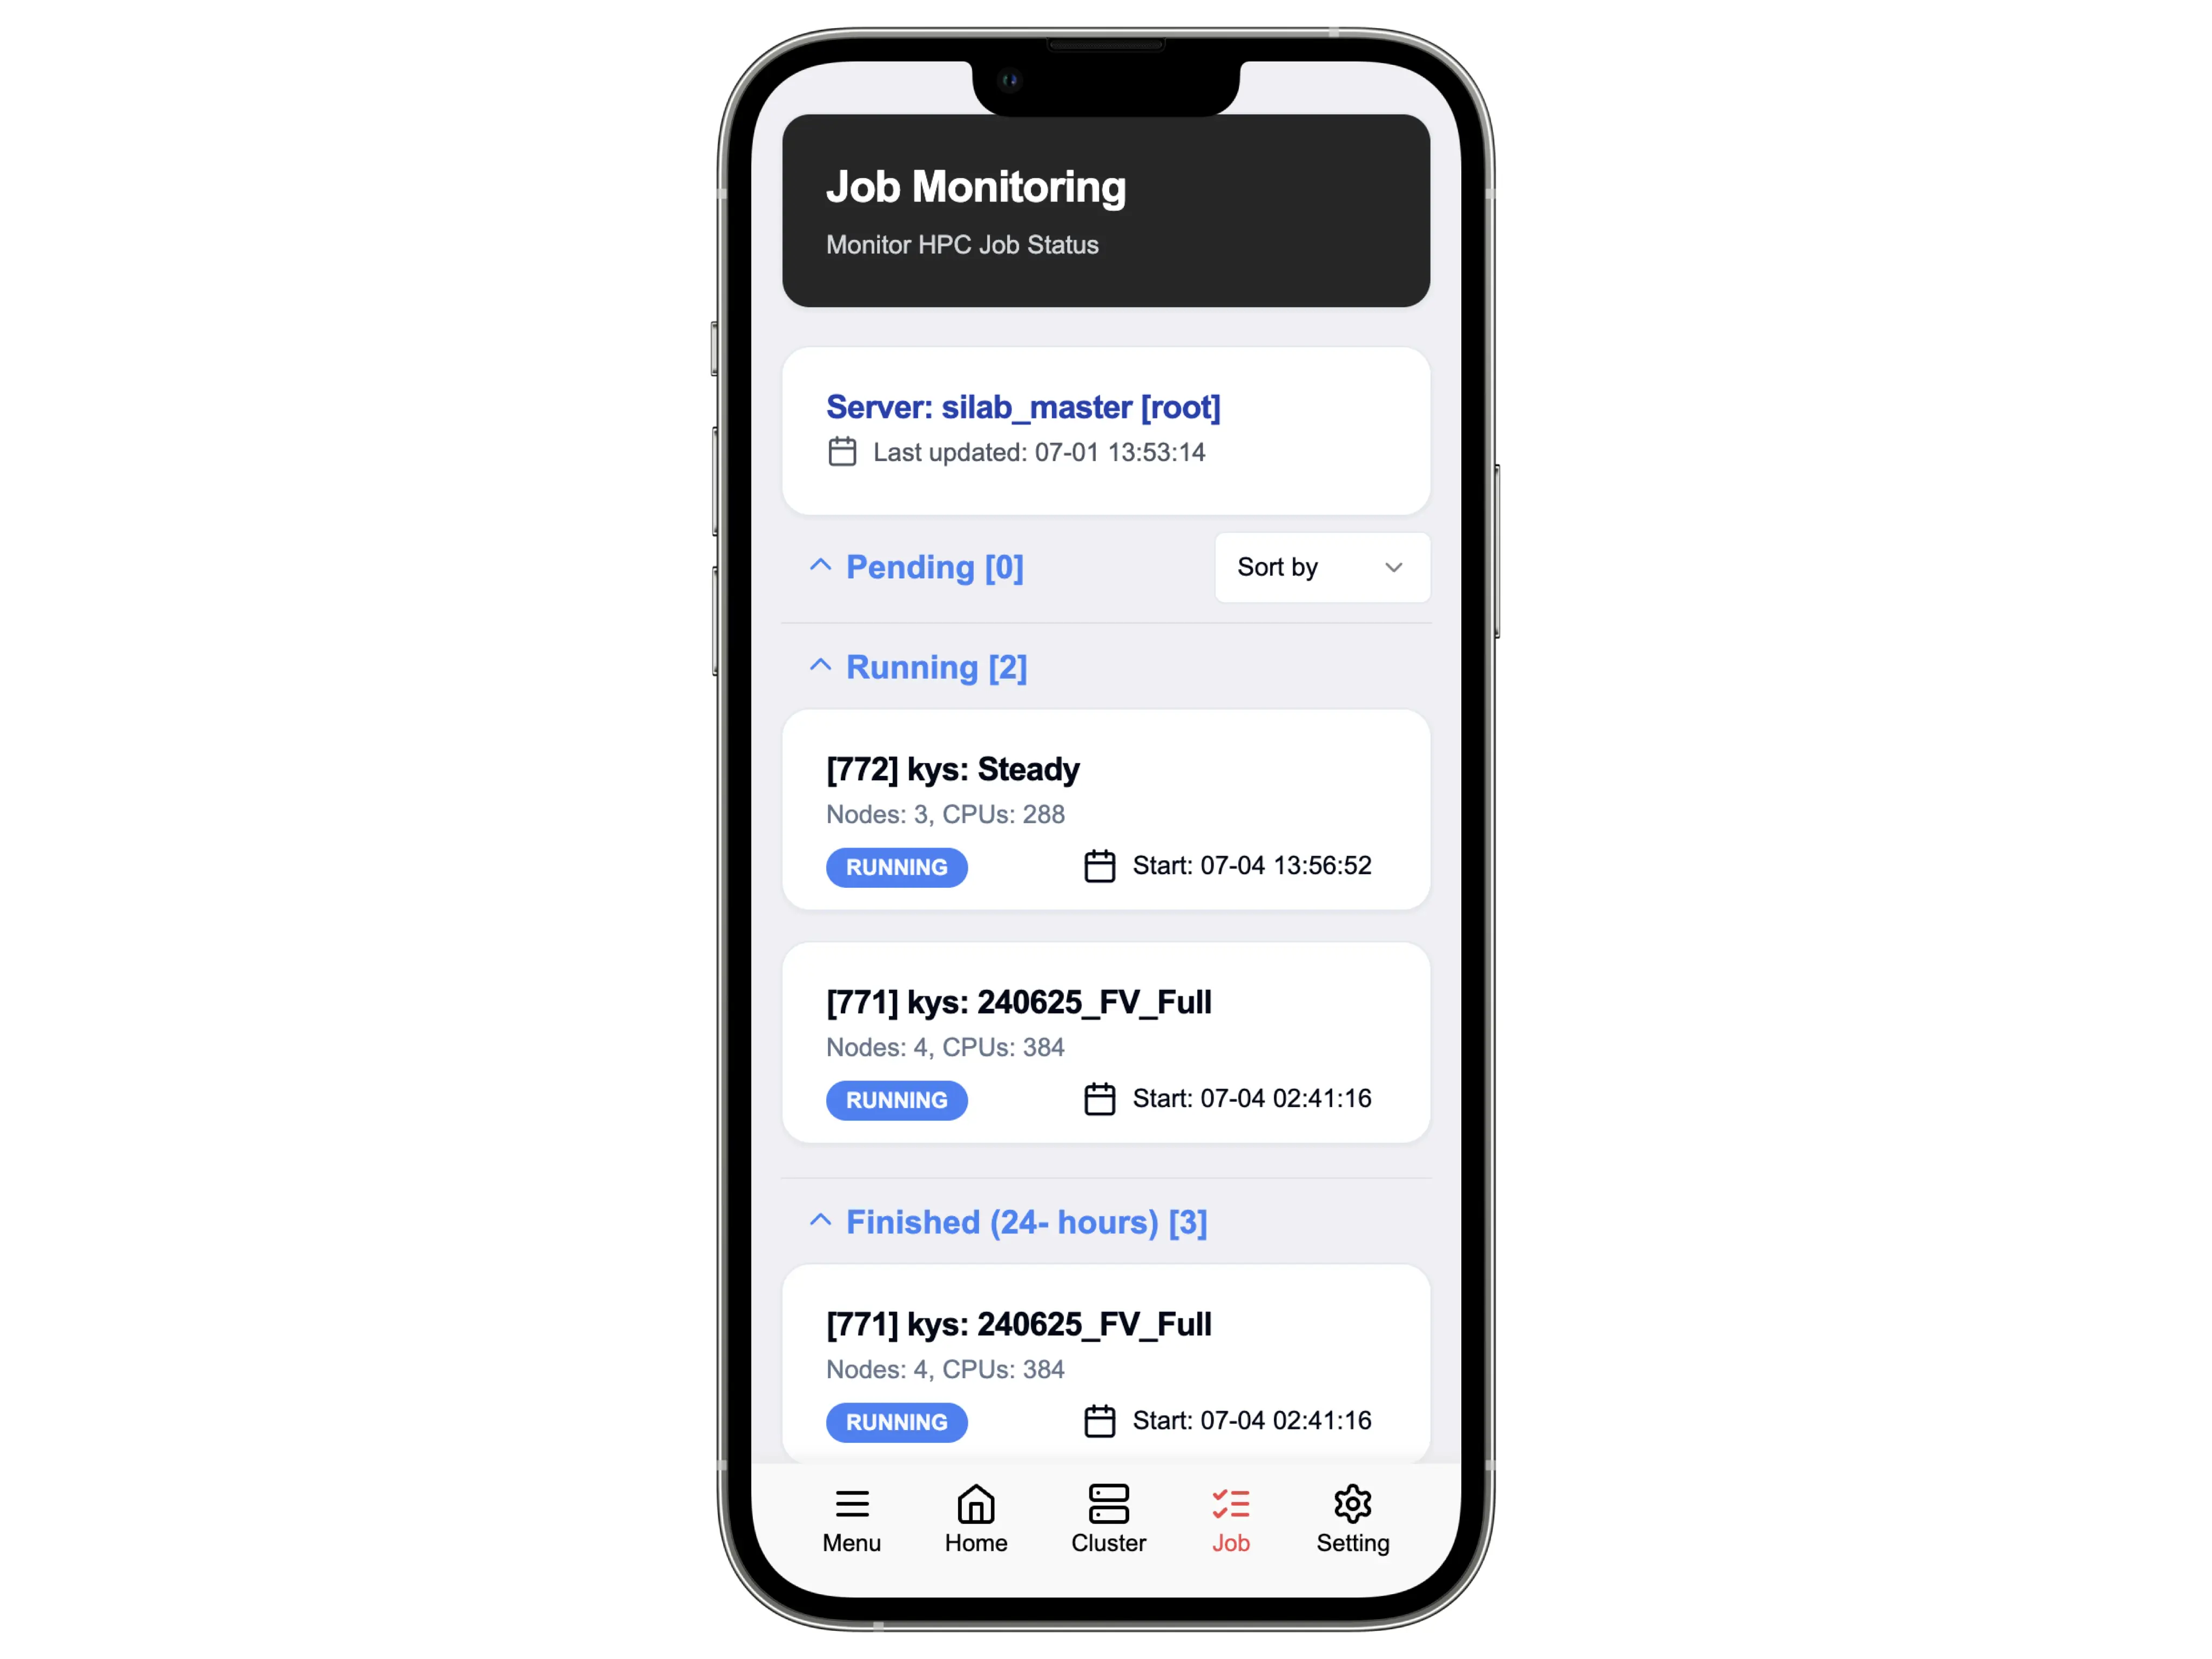
The Job Monitoring feature in DQue Mobile provides real-time information about your HPC jobs, allowing you to track job status, resource allocation, and execution times from your mobile device.
Job Status Categories
Section titled “Job Status Categories”The Job Monitoring screen organizes jobs into different categories for easier tracking:
Pending Jobs
Section titled “Pending Jobs”Jobs that are waiting to be scheduled and executed. The number in brackets indicates the count of jobs in this category.
Running Jobs
Section titled “Running Jobs”Jobs that are currently executing on the cluster. The number in brackets shows how many jobs are currently running.
Finished Jobs (24+ hours)
Section titled “Finished Jobs (24+ hours)”Jobs that have completed within the last 24+ hours. This provides a history of recent job activity.
Job Information Details
Section titled “Job Information Details”For each job, the following information is displayed:
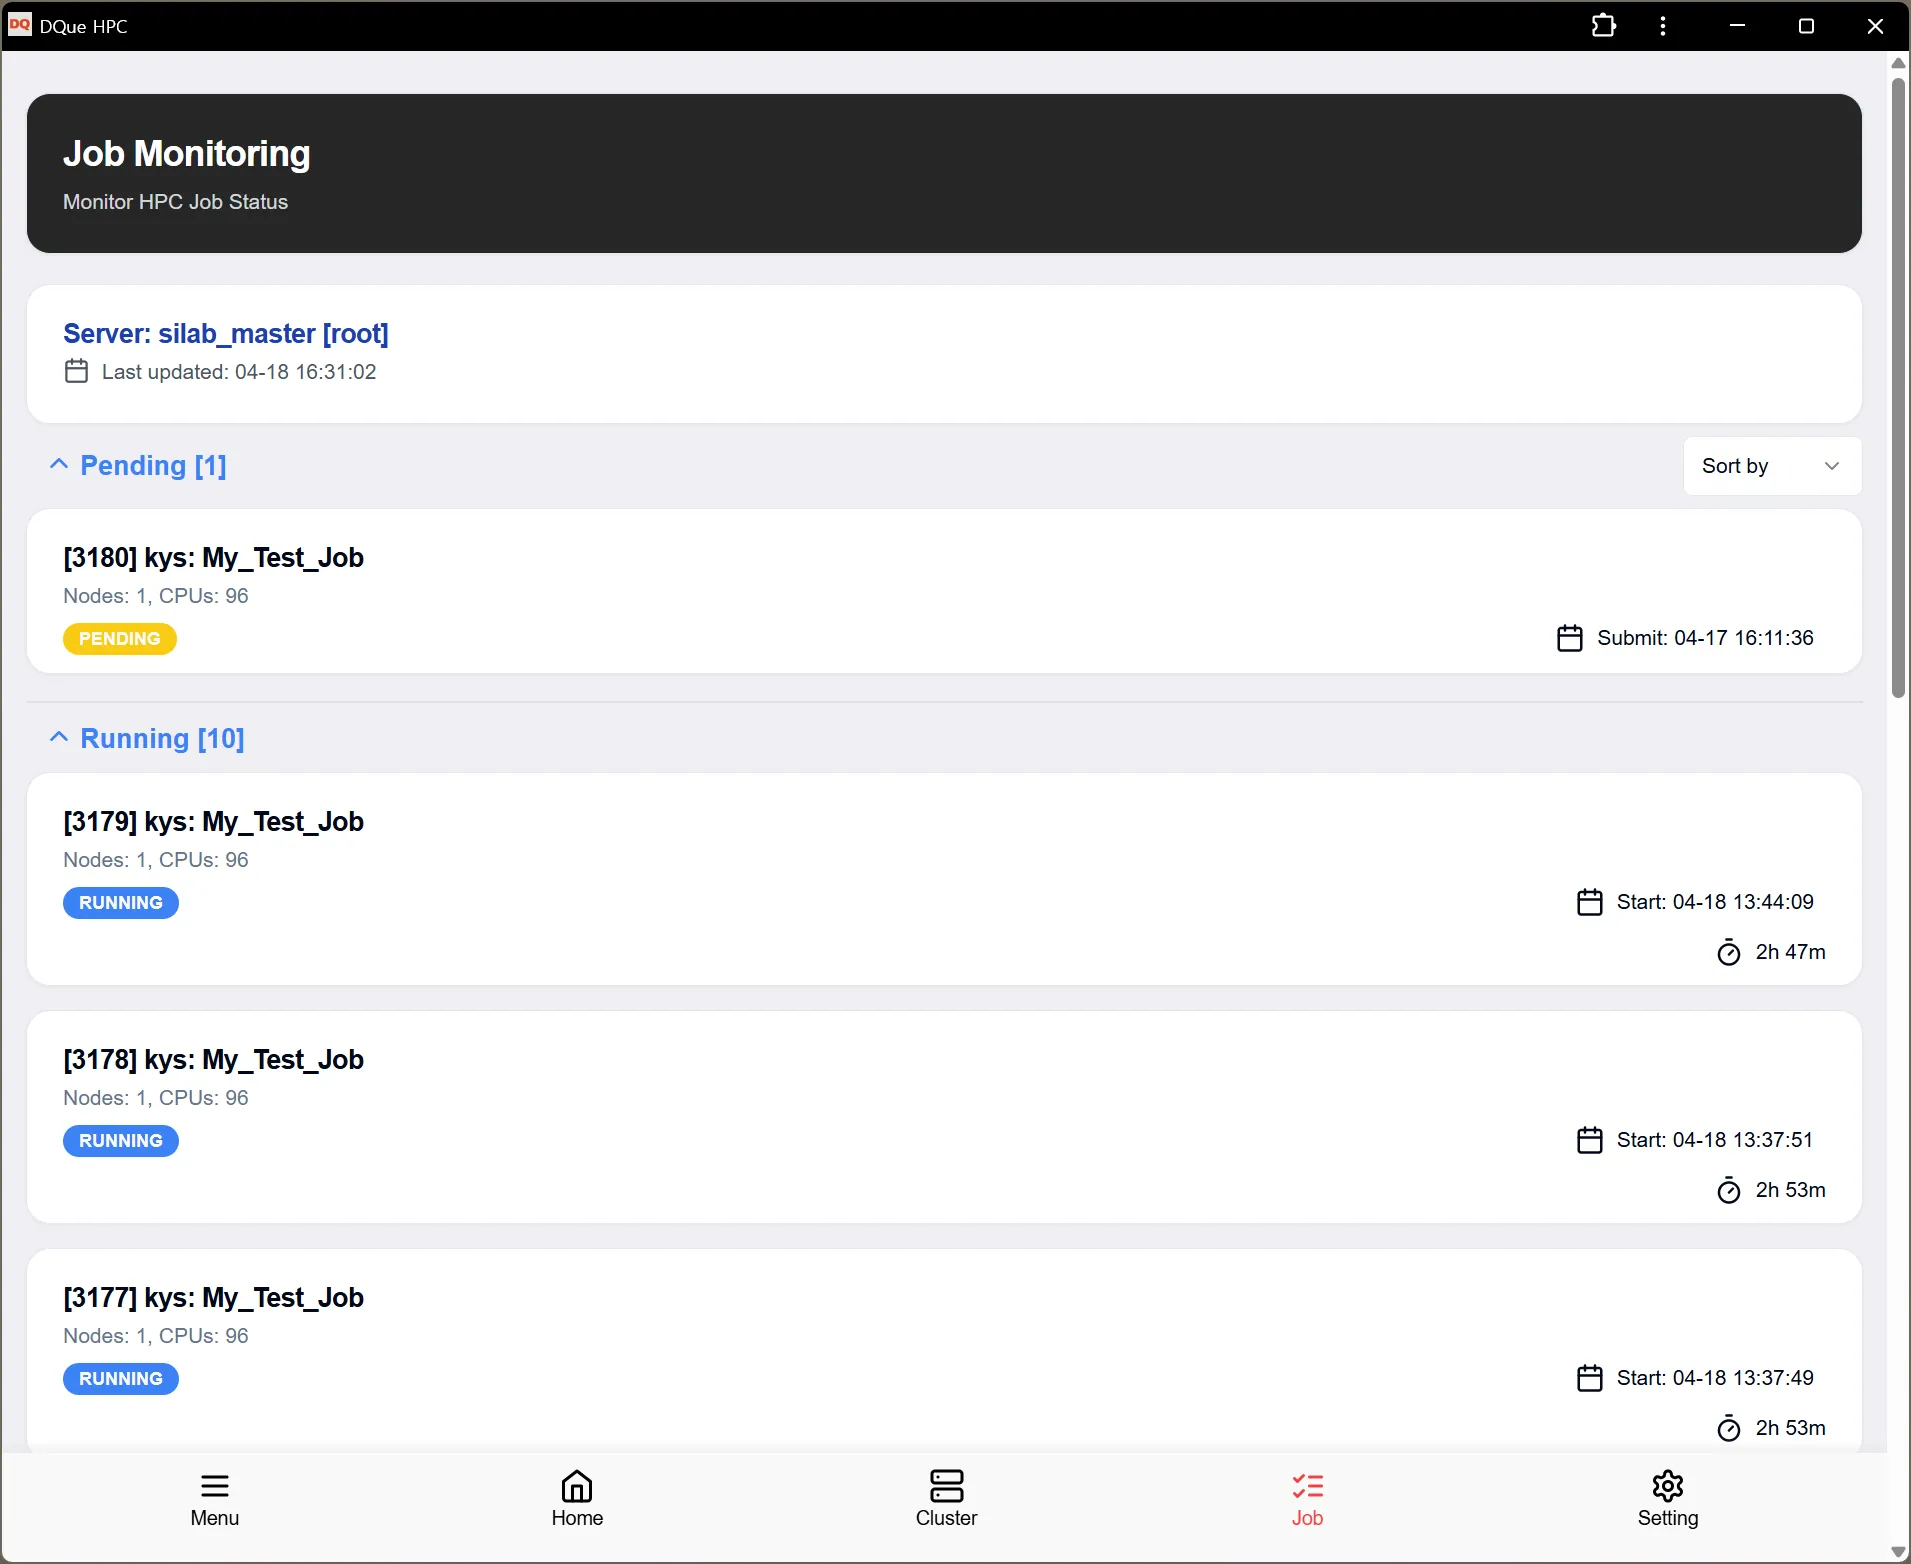
- Job ID: A unique identifier for the job (e.g., [3180], [3179])
- User: The user who submitted the job (kys)
- Job Name: The name assigned to the job (e.g., “My_Test_Job”)
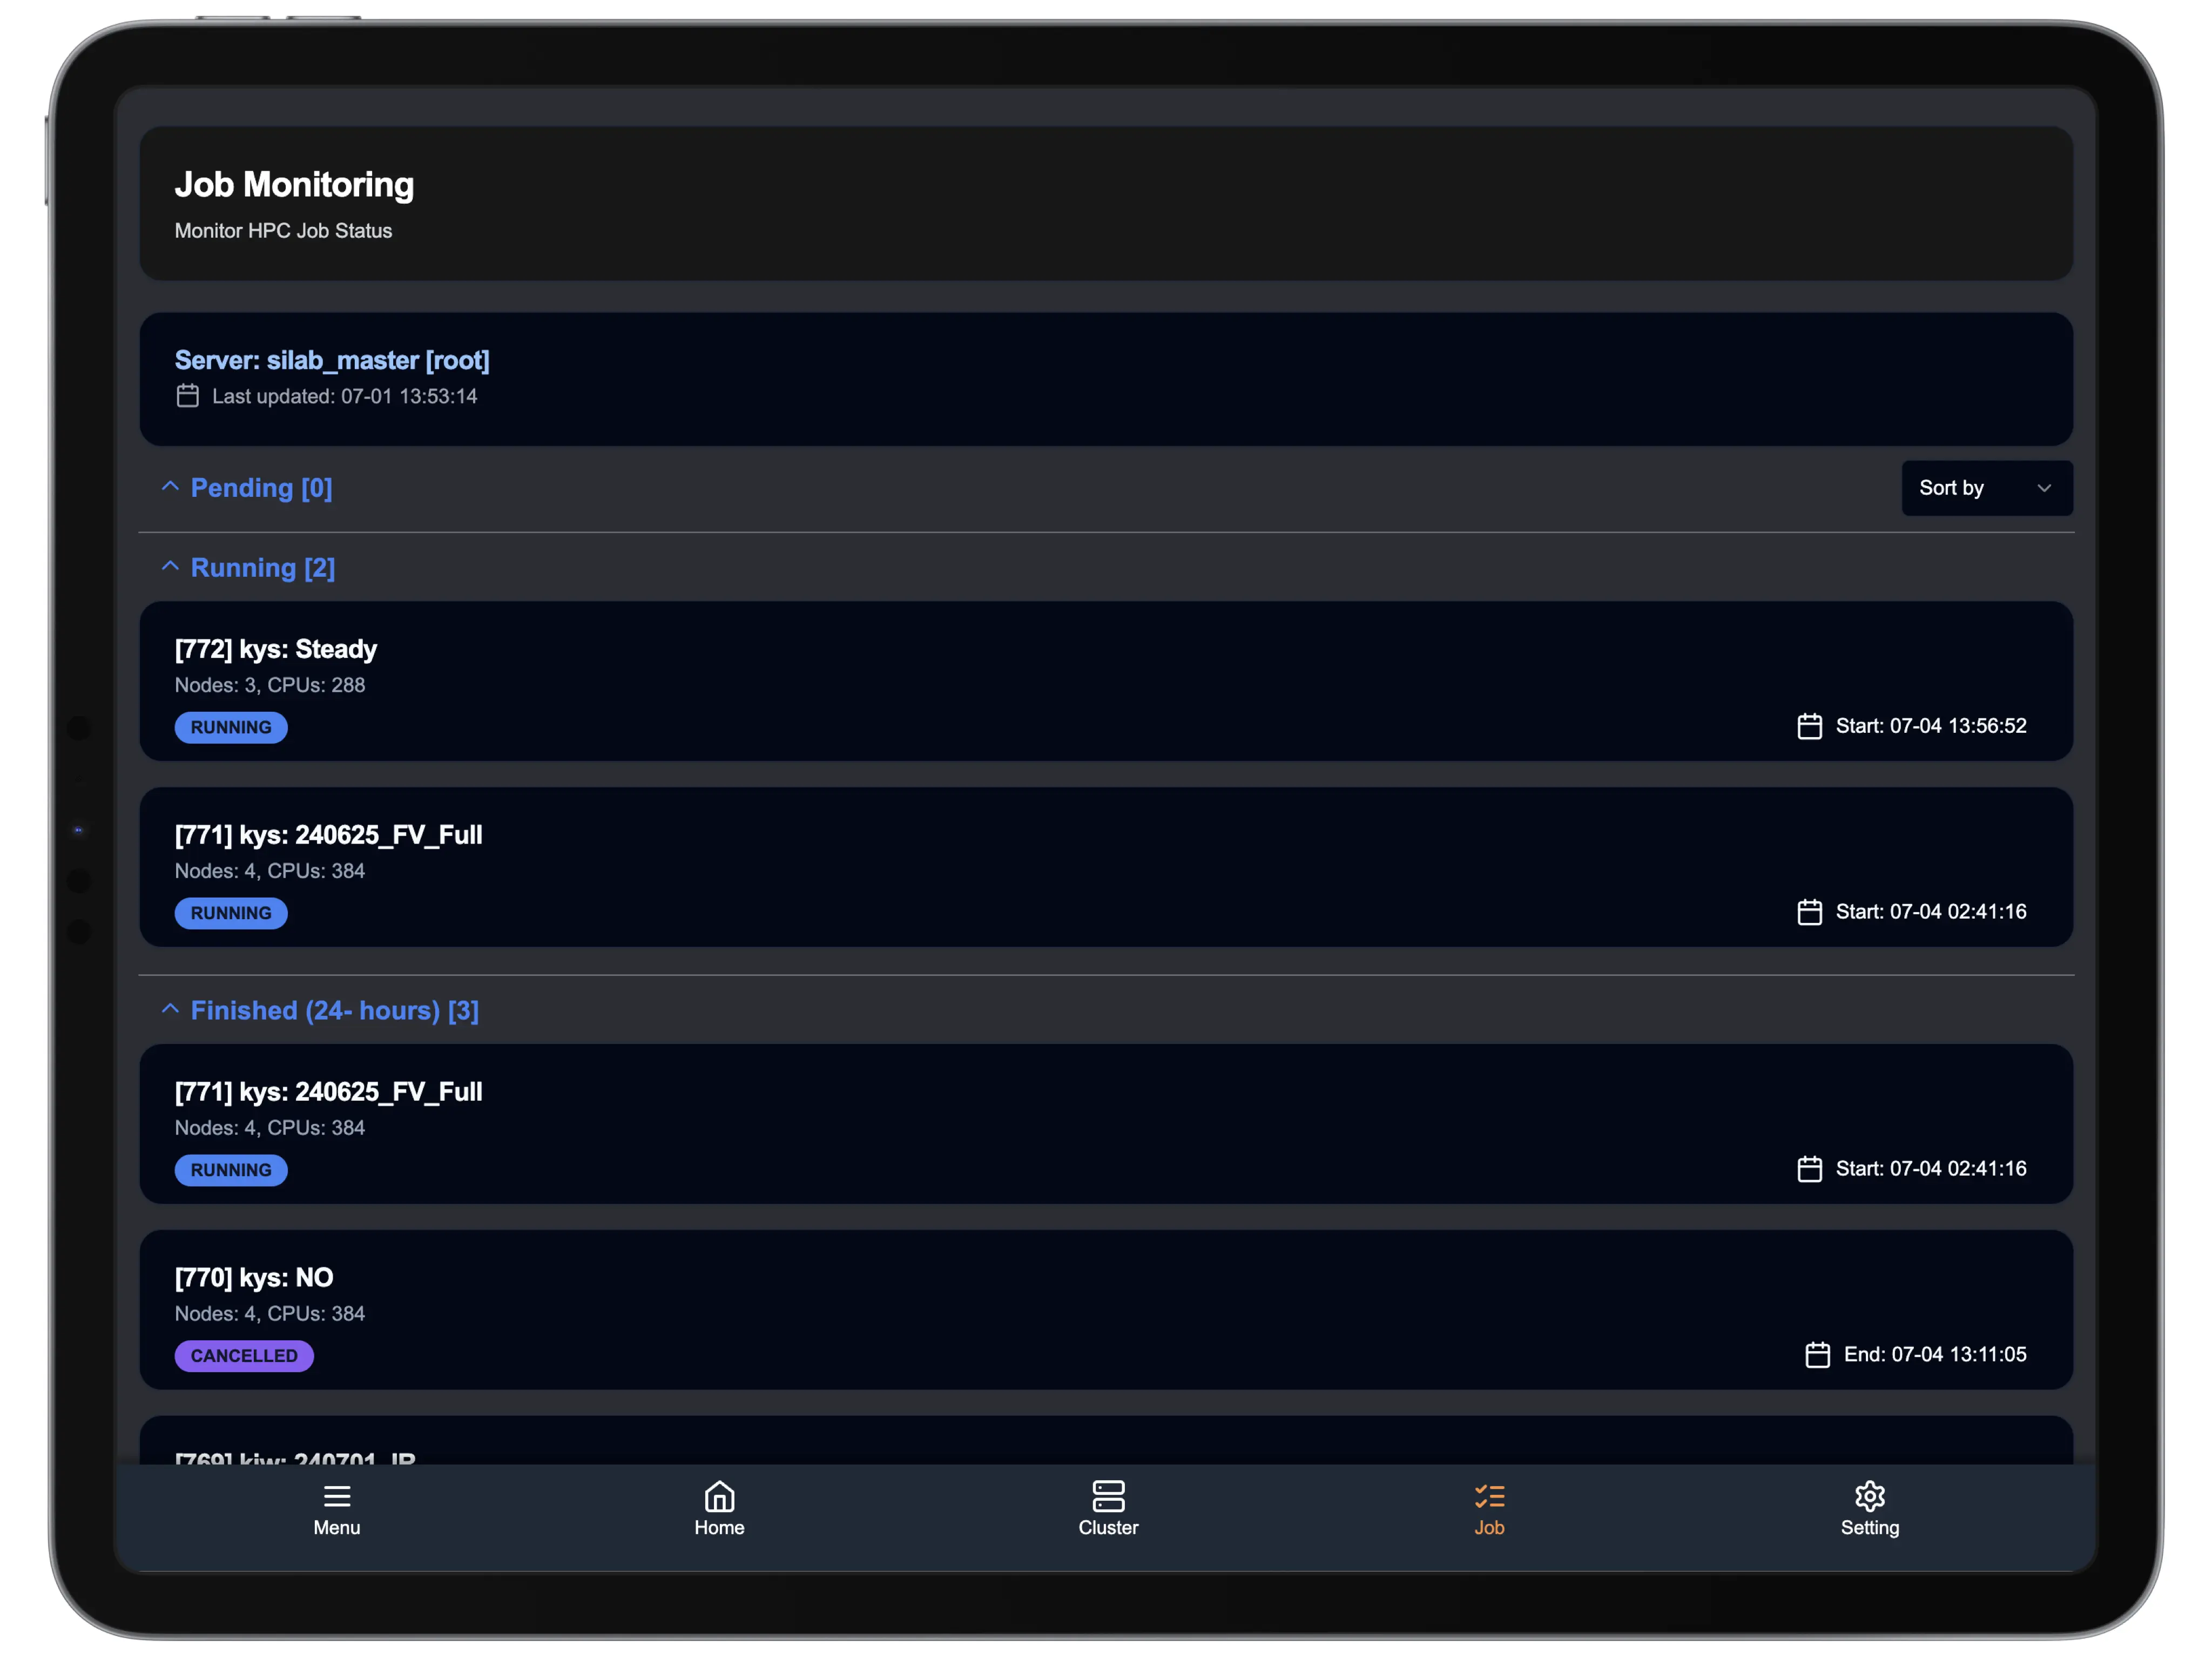
- Status Badge: Visual indicator of job status (RUNNING, PENDING, CANCELLED, etc.)
- Resource Allocation:
- Nodes: Number of nodes allocated to the job
- CPUs: Number of CPU cores allocated
- Timing Information:
- Submit: When the job was submitted (for pending jobs)
- Start: When the job began execution
- Duration: How long the job has been running (for running jobs)
- End: When the job completed (for finished jobs)
Sort Options
Section titled “Sort Options”You can sort the job list using the “Sort by” dropdown menu in the upper right corner, allowing you to organize jobs based on different criteria such as submission time, priority, or job name.
Collapsible Sections
Section titled “Collapsible Sections”Each job status category (Pending, Running, Finished) can be collapsed or expanded by tapping on the section header, allowing you to focus on the information that matters most to you.
Navigation
Section titled “Navigation”The bottom navigation bar allows you to quickly switch between different monitoring views:
- Menu: Access application settings and options
- Home: Return to the main dashboard
- Cluster: Switch to cluster monitoring view
- Job: View job monitoring (current screen)
- Setting: Access application settings