Cluster
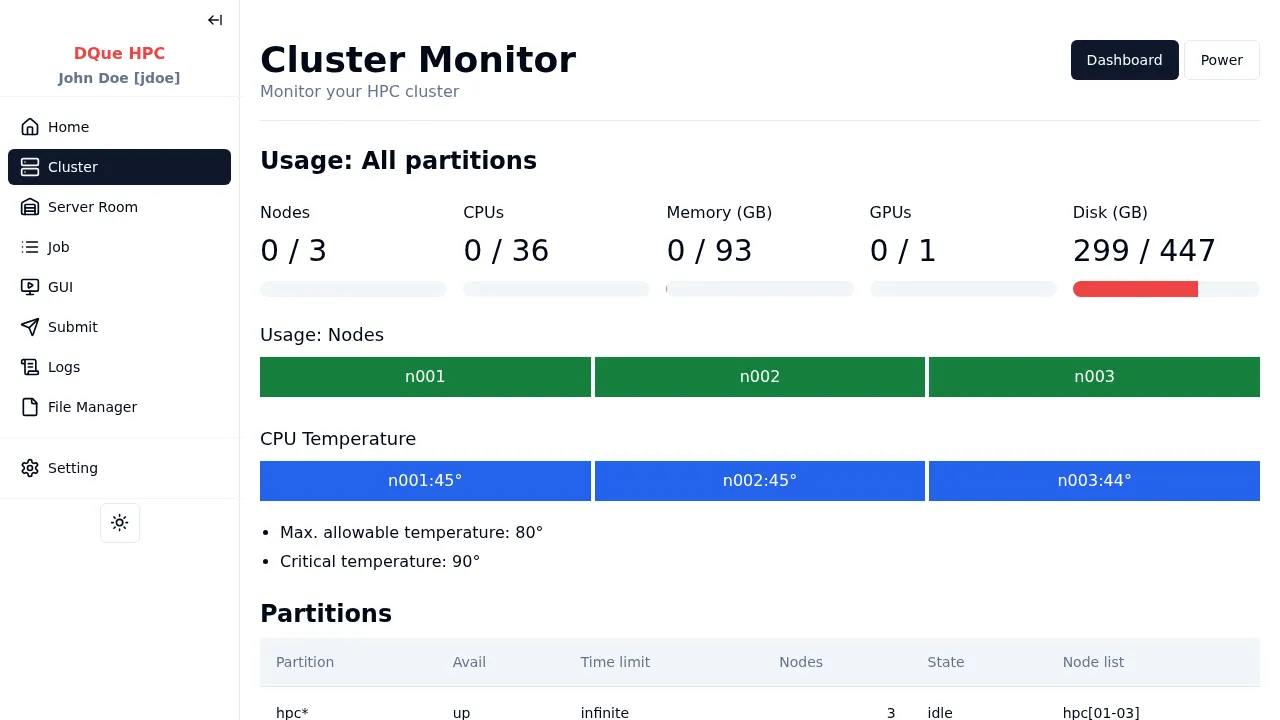
This page provides a real-time overview of the HPC cluster’s status and resource utilization.
Overview Sections
Section titled “Overview Sections”- Overall Usage (All Partitions): Displays the current usage across the entire cluster for key resources:
- Nodes: Number of active nodes out of the total available (e.g., 4 / 5).
- CPUs: Total allocated CPU cores versus the total available cores (e.g., 24 / 60).
- Memory (GB): Total allocated memory versus the total available memory (e.g., 124 / 155 GB).
- GPUs: Total allocated GPUs versus the total available GPUs (e.g., 0 / 1).
- Disk (GB): Total used disk space versus the total available disk space (e.g., 234 / 447 GB).
- Node Usage Bars: Visual representation of the status or load for individual nodes (e.g.,
n001,n002, etc.). - CPU Temperature: Shows the current temperature for each node’s CPU, along with the maximum allowed and critical temperature thresholds.
- Partitions Table: Lists the available Slurm partitions with details:
Partition: Name of the partition (e.g.,hpc*,hpc).Avail: Availability status (e.g.,up).Time limit: Maximum runtime allowed for jobs in the partition (e.g.,infinite).Nodes: Number of nodes associated with the partition.State: Current state of the partition (e.g.,mixed,idle).Node list: The nodes belonging to the partition (e.g.,hpc[01-04]).
- Nodes Table: Provides detailed information about each individual node:
Node: Node hostname (e.g.,hpc01).Partitions: The partition(s) the node belongs to.State: Current state of the node (e.g.,MIXED).CPU Alloc: Number of allocated CPU cores.Mem Alloc (GB): Amount of allocated memory.GPU Alloc: Number of allocated GPUs.CPU Usage (%): Current CPU utilization percentage.Mem Usage (%): Current memory utilization percentage.GPU Usage (%): Current GPU utilization percentage.
Open Dashboard Button
Section titled “Open Dashboard Button”Clicking the Open Dashboard button in the top right corner opens the Cluster Monitoring Dashboard page, which provides more detailed historical data and granular metrics.