Dashboard
The detailed dashboard (typically accessed via the “Open Dashboard” button on the main Cluster Monitoring page) provides in-depth visualization of cluster performance and resource usage over time.
CPU Overview
Section titled “CPU Overview”
- CPU Usage (Gauge & Pie Chart): Shows the current overall CPU utilization percentage and a breakdown of allocated vs. idle cores.
- CPU Total / Allocated / Idle: Displays the exact number of cores in each state.
- CPU Usage per User (Gauge & Graph): Tracks CPU usage attributed to each user.
- CPU Usage per Partition (Gauge & Graph): Monitors CPU usage within each Slurm partition.
- CPUs Allocated per Partition: Shows the number of cores allocated in each partition over time.
Cluster Nodes & SLURM Jobs
Section titled “Cluster Nodes & SLURM Jobs”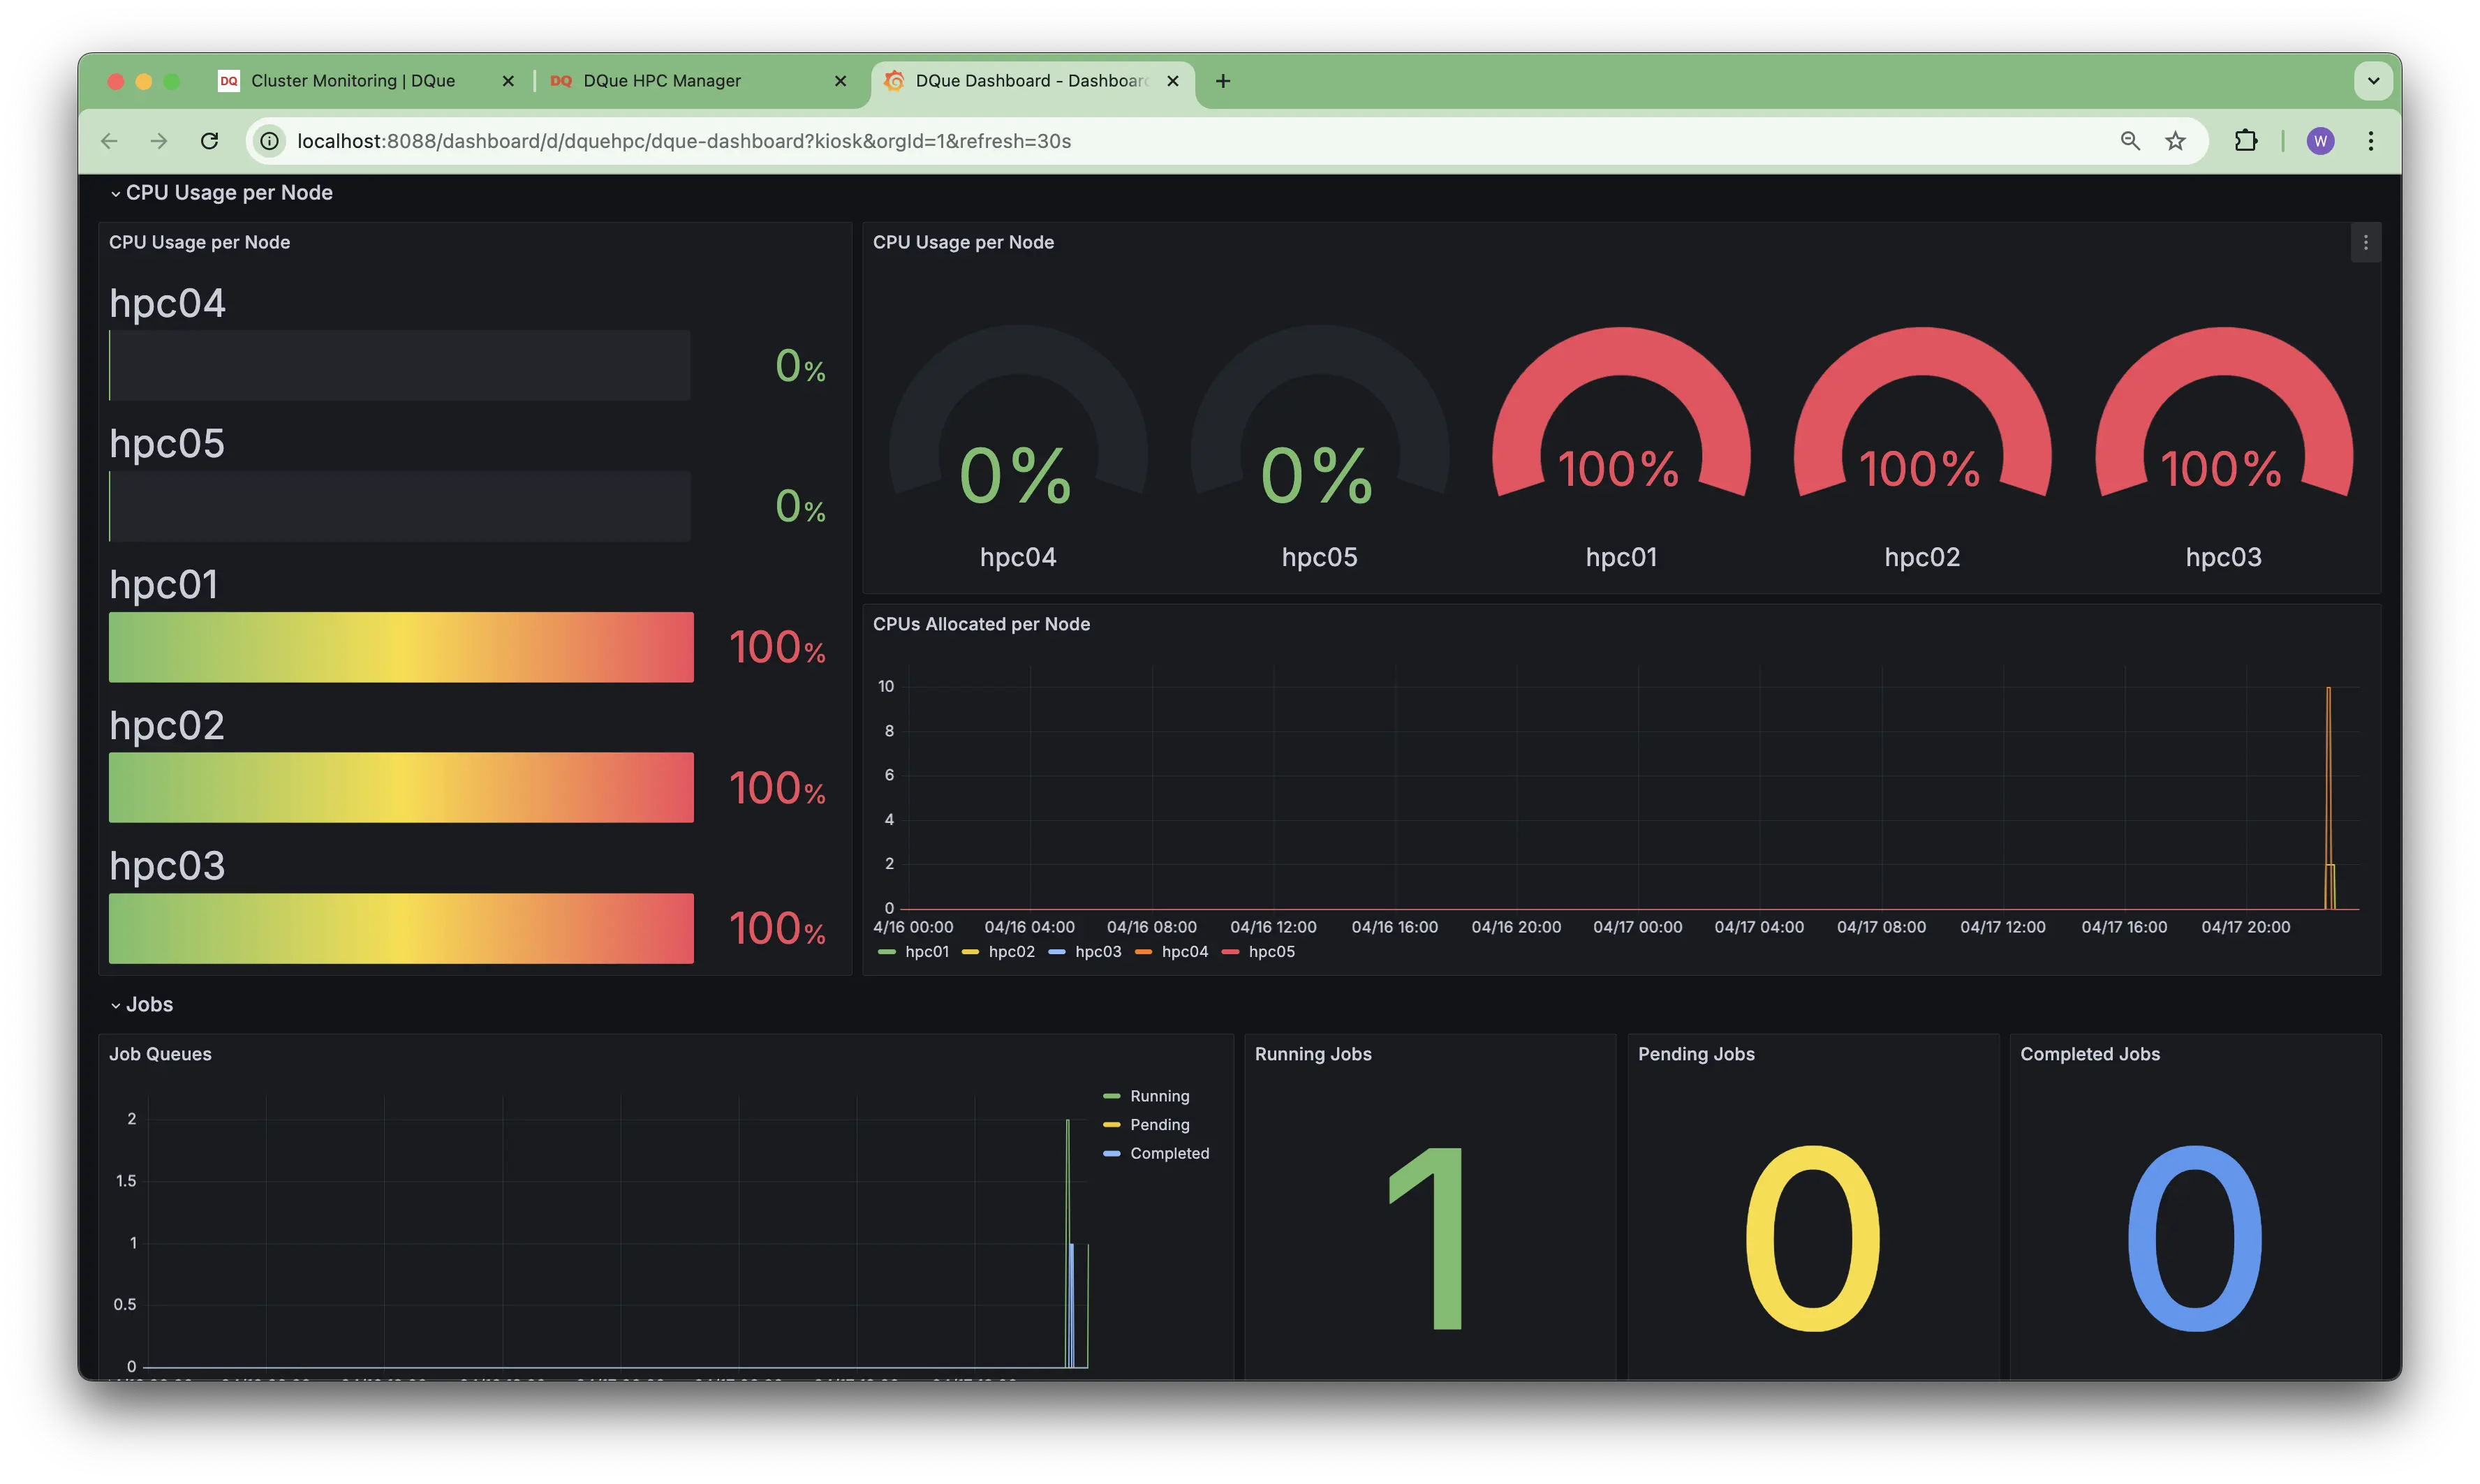
- Cluster Nodes: Tracks the state of nodes over time (Allocated, Mixed, Idle, Total).
- Fail/Down/Drain/Err Nodes: Monitors the number of nodes in problematic states.
- SLURM Jobs: Shows the number of running, pending, and completed jobs over time.
- Fail/Susp/Canc/Preempt/Timeout Jobs: Tracks the number of jobs ending in various non-completed states.
CPU & Job Usage per Node
Section titled “CPU & Job Usage per Node”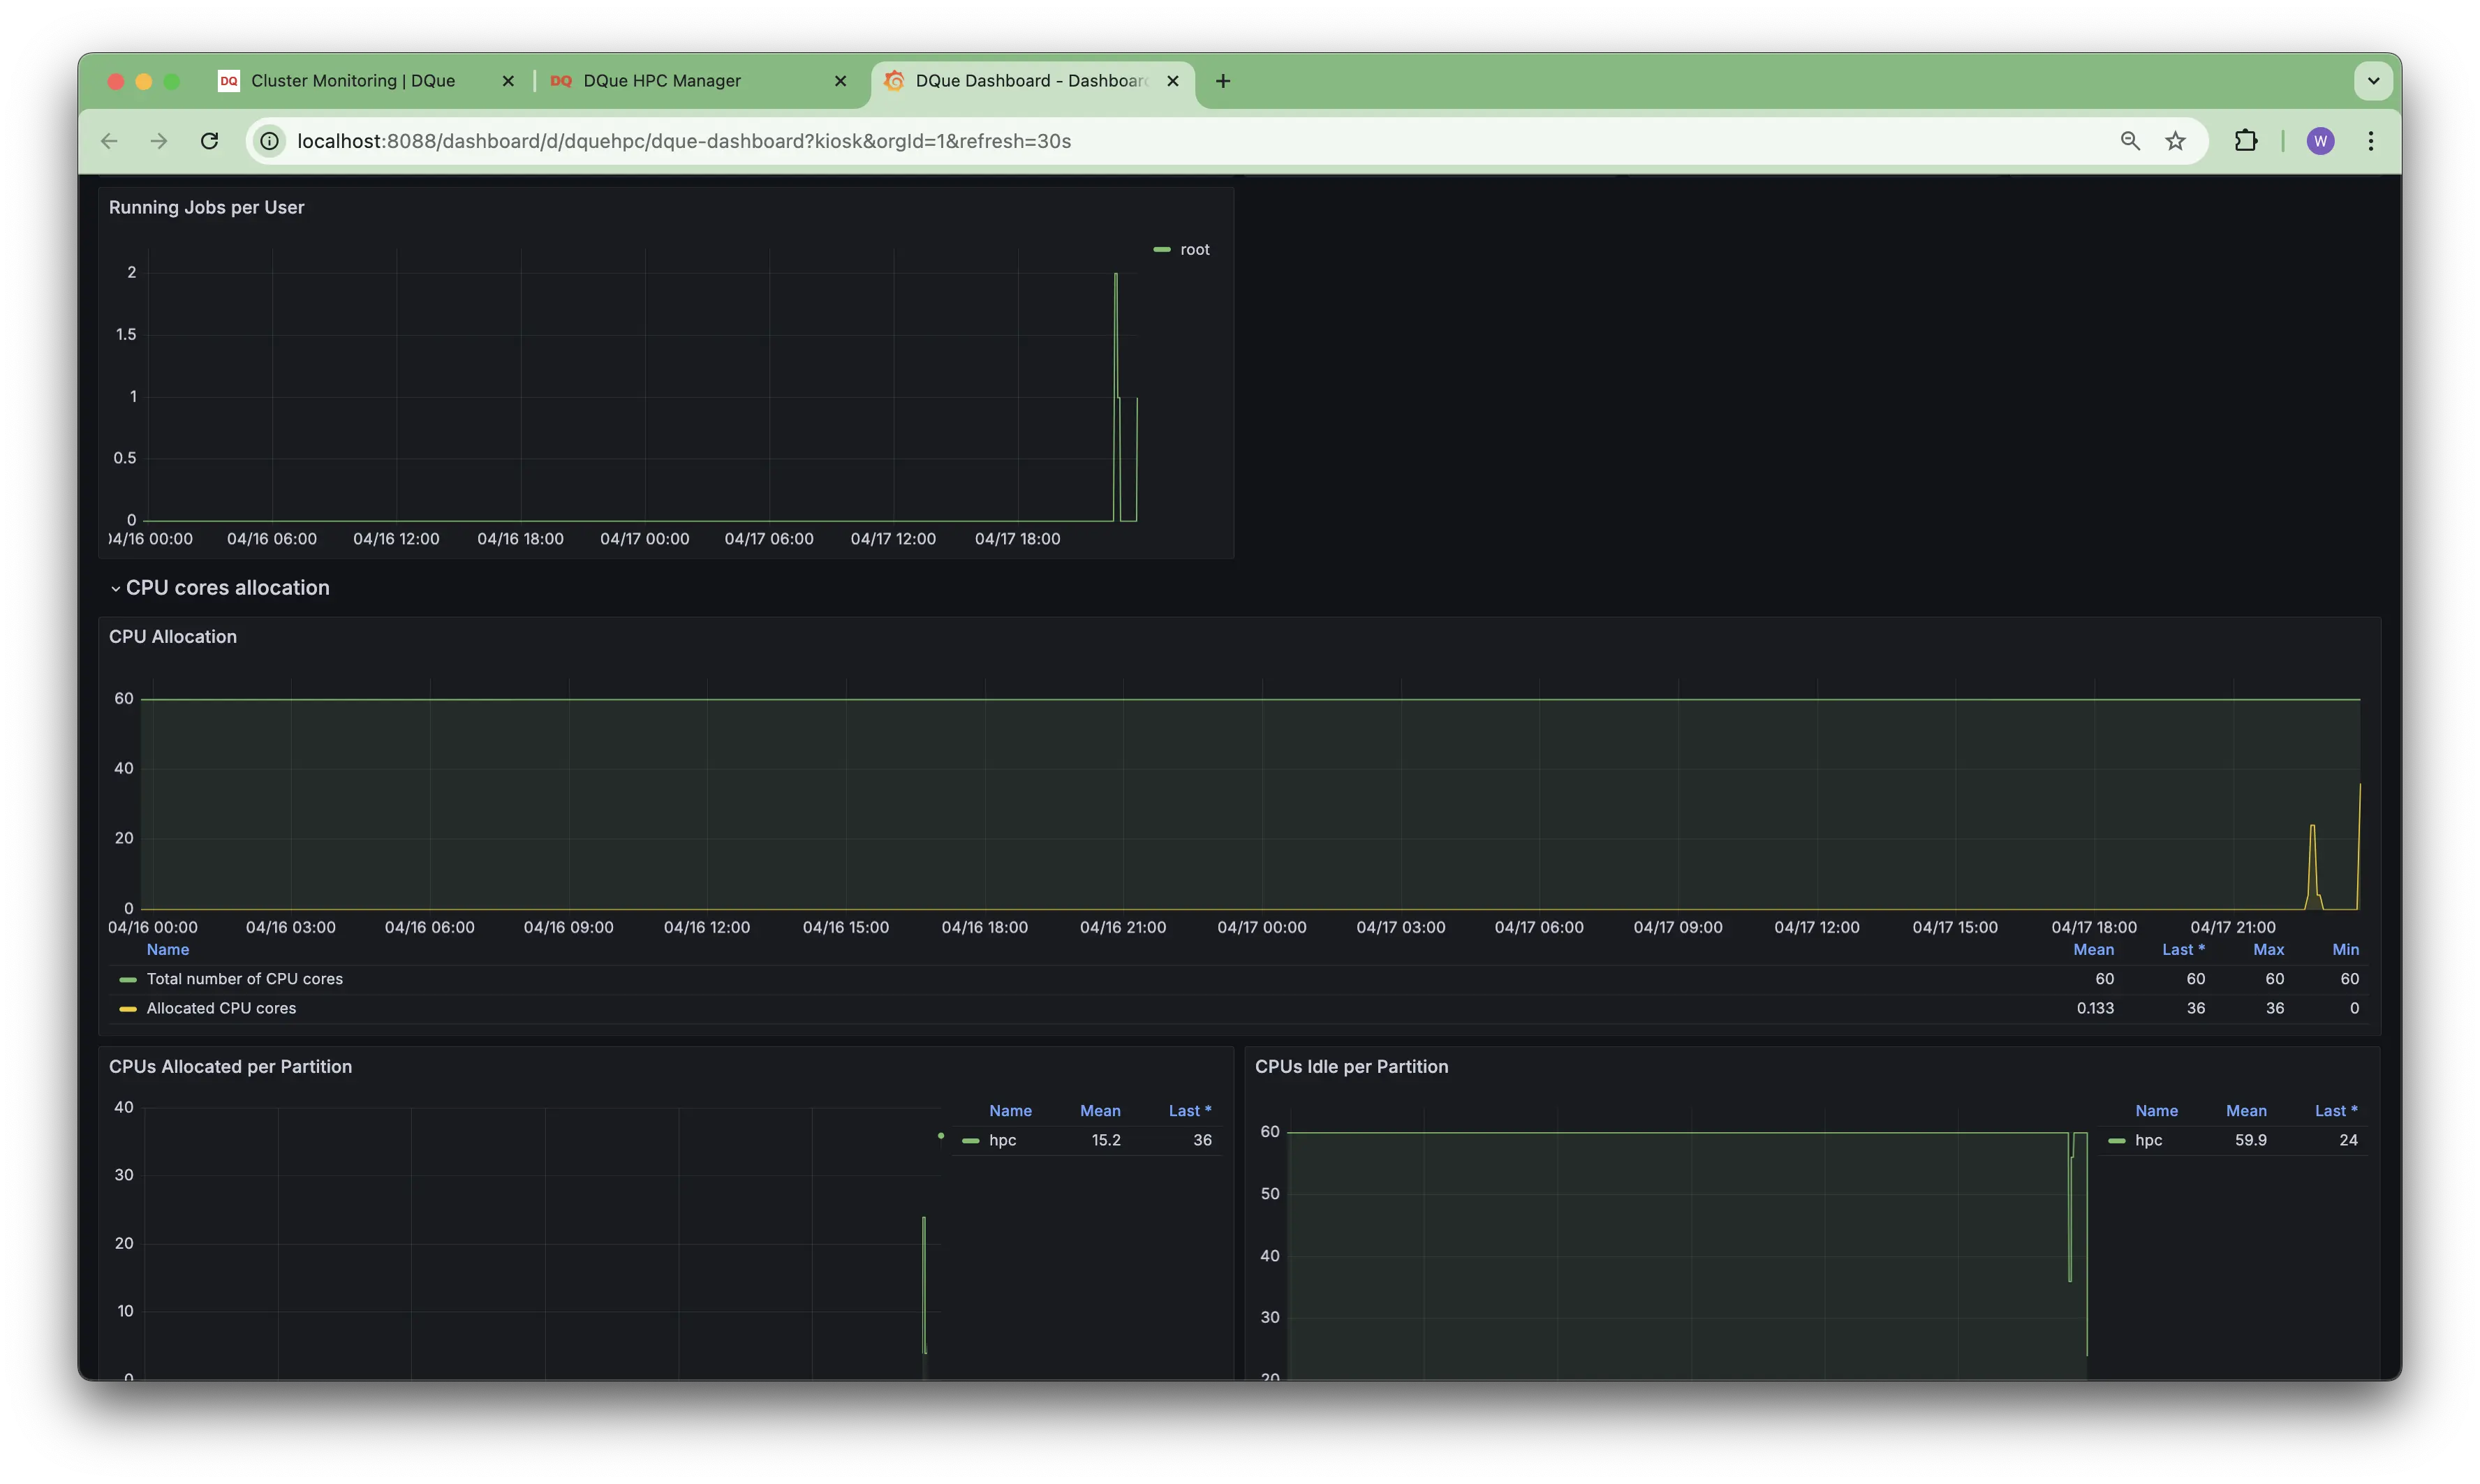
- CPU Usage per Node (Bar & Gauge): Displays current CPU usage for each individual node.
- CPUs Allocated per Node (Graph): Shows the history of CPU allocation for each node.
- Job Queues (Graph): Tracks the number of running, pending, and completed jobs over time (cluster-wide).
- Running / Pending / Completed Jobs (Numerical): Displays the current count for each job state.
CPU Core Allocation & User Jobs
Section titled “CPU Core Allocation & User Jobs”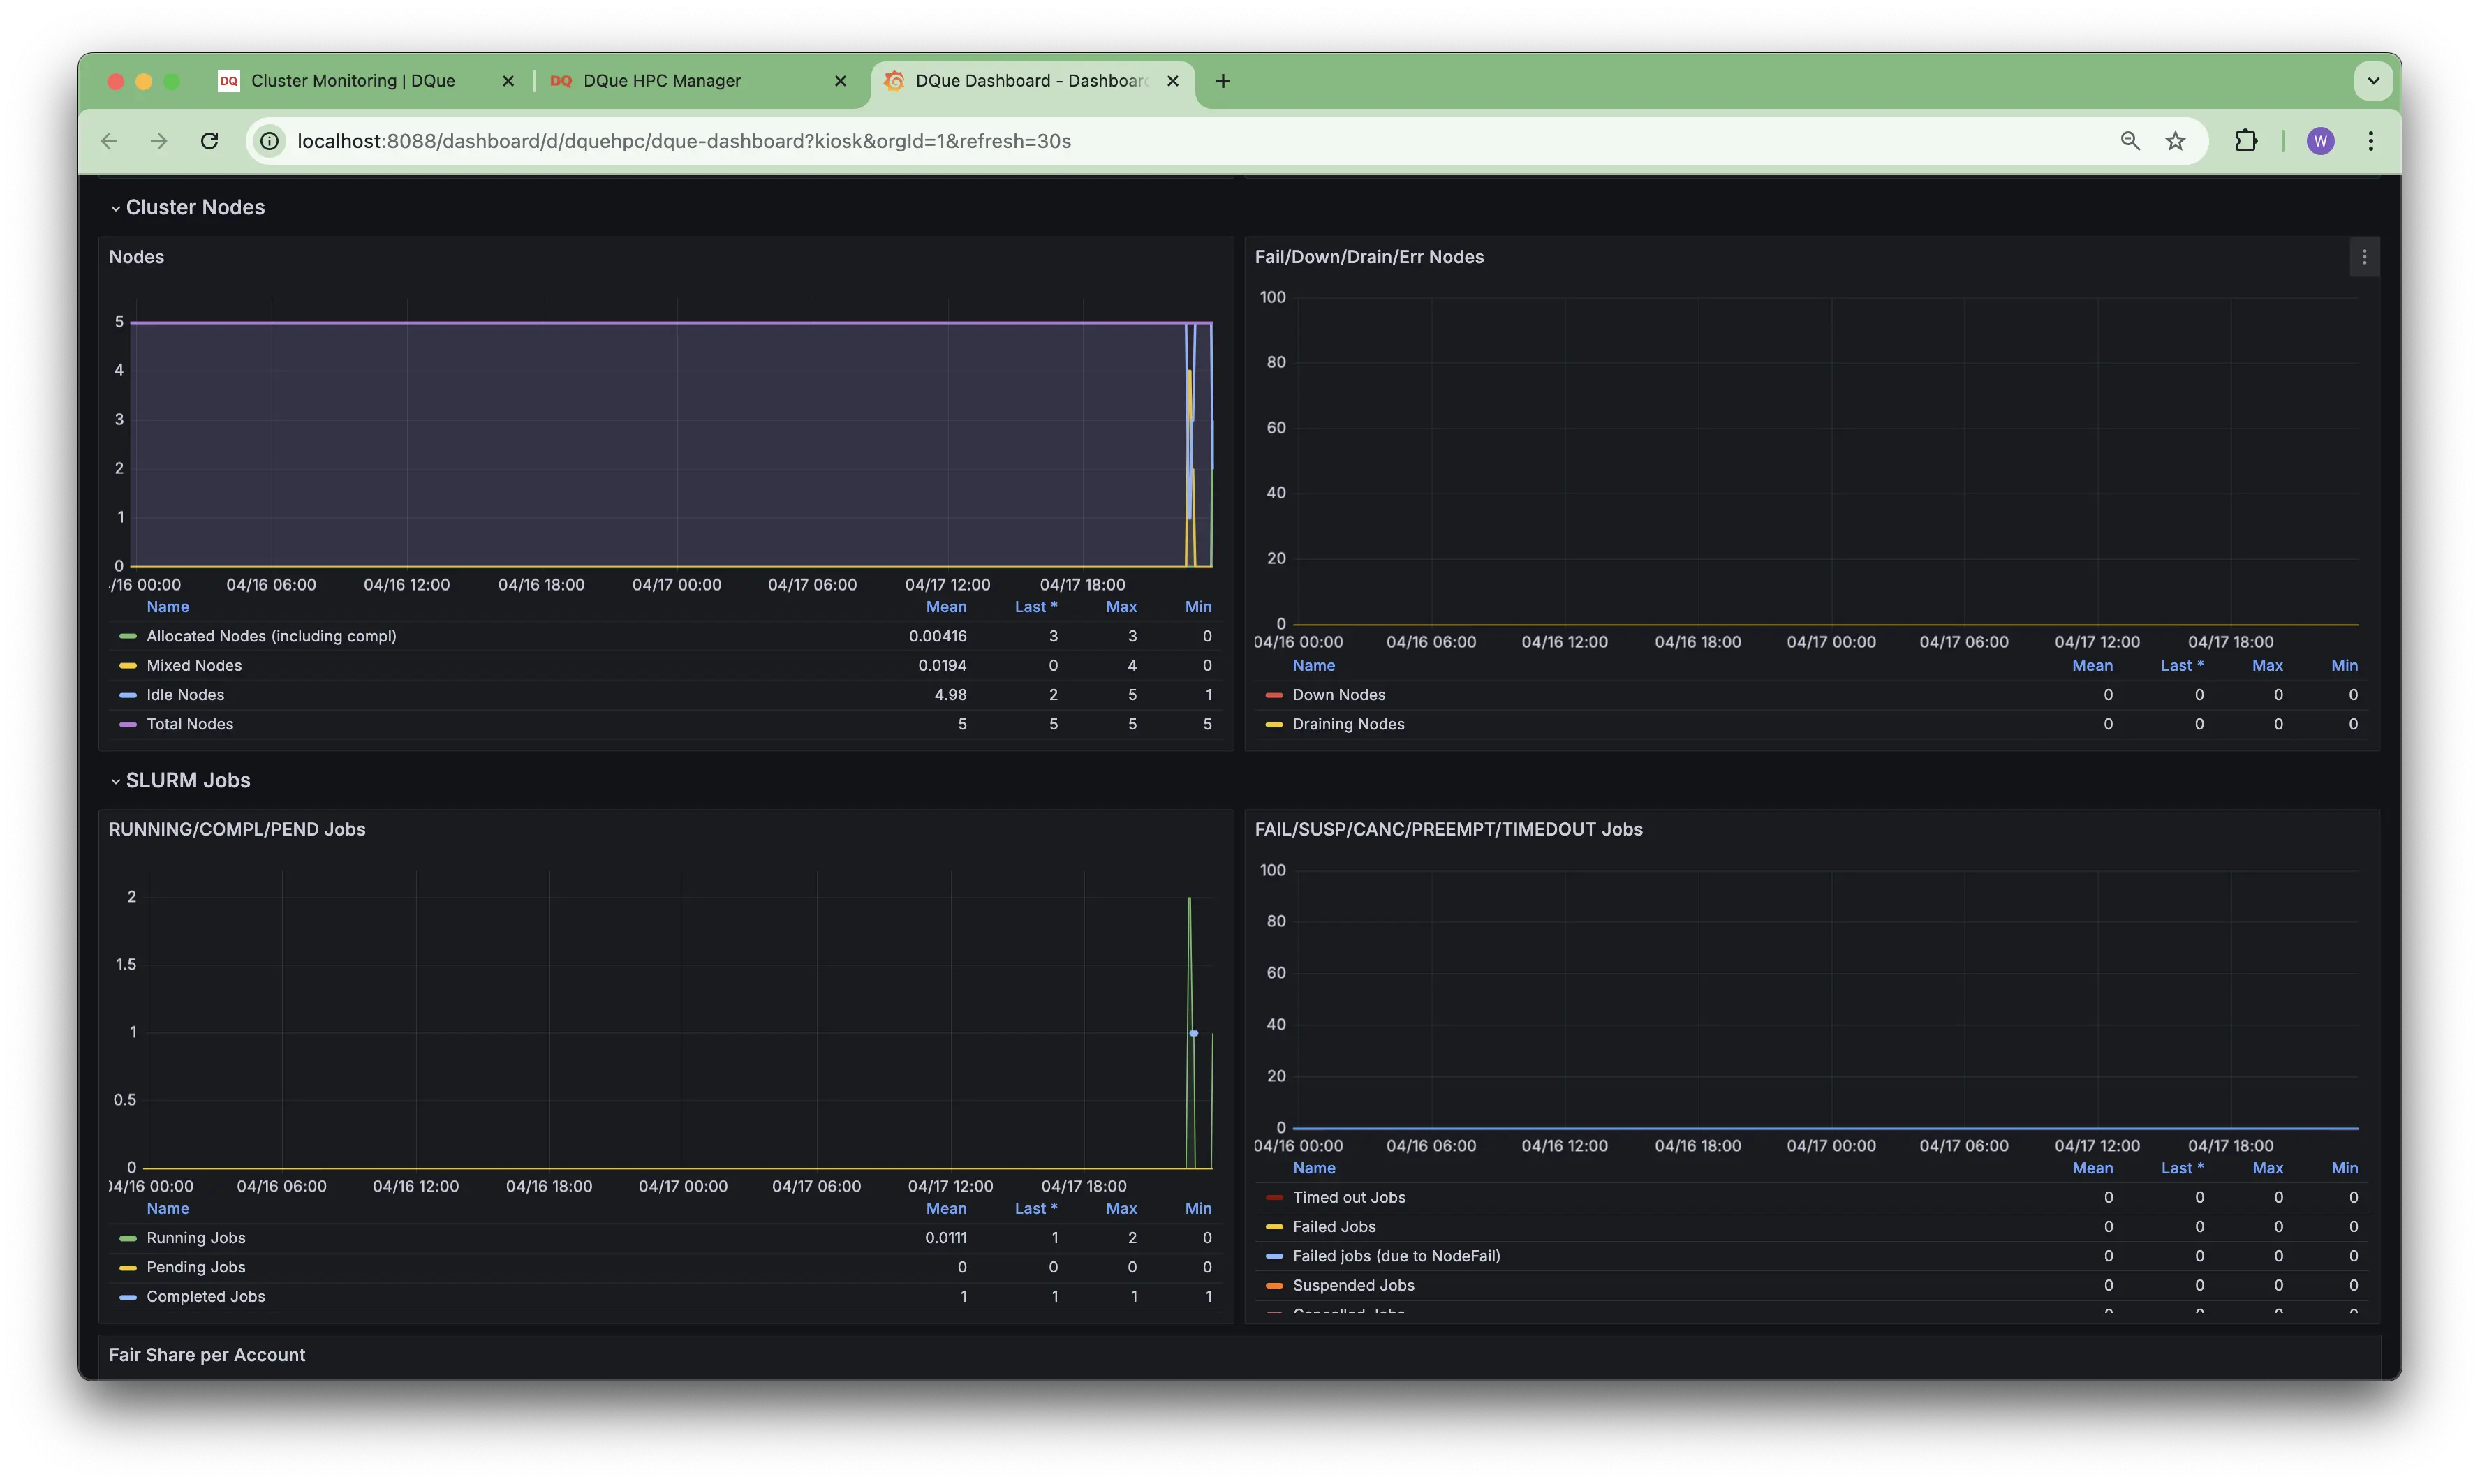
- Running Jobs per User: Shows the number of currently running jobs for each user.
- CPU Cores Allocation (Graph): Tracks the total number of CPU cores and the number of allocated cores over time.
- CPUs Allocated per Partition (Graph): Shows core allocation history broken down by partition.
- CPUs Idle per Partition (Graph): Tracks the number of idle cores within each partition over time.
Fair Share & Account Usage
Section titled “Fair Share & Account Usage”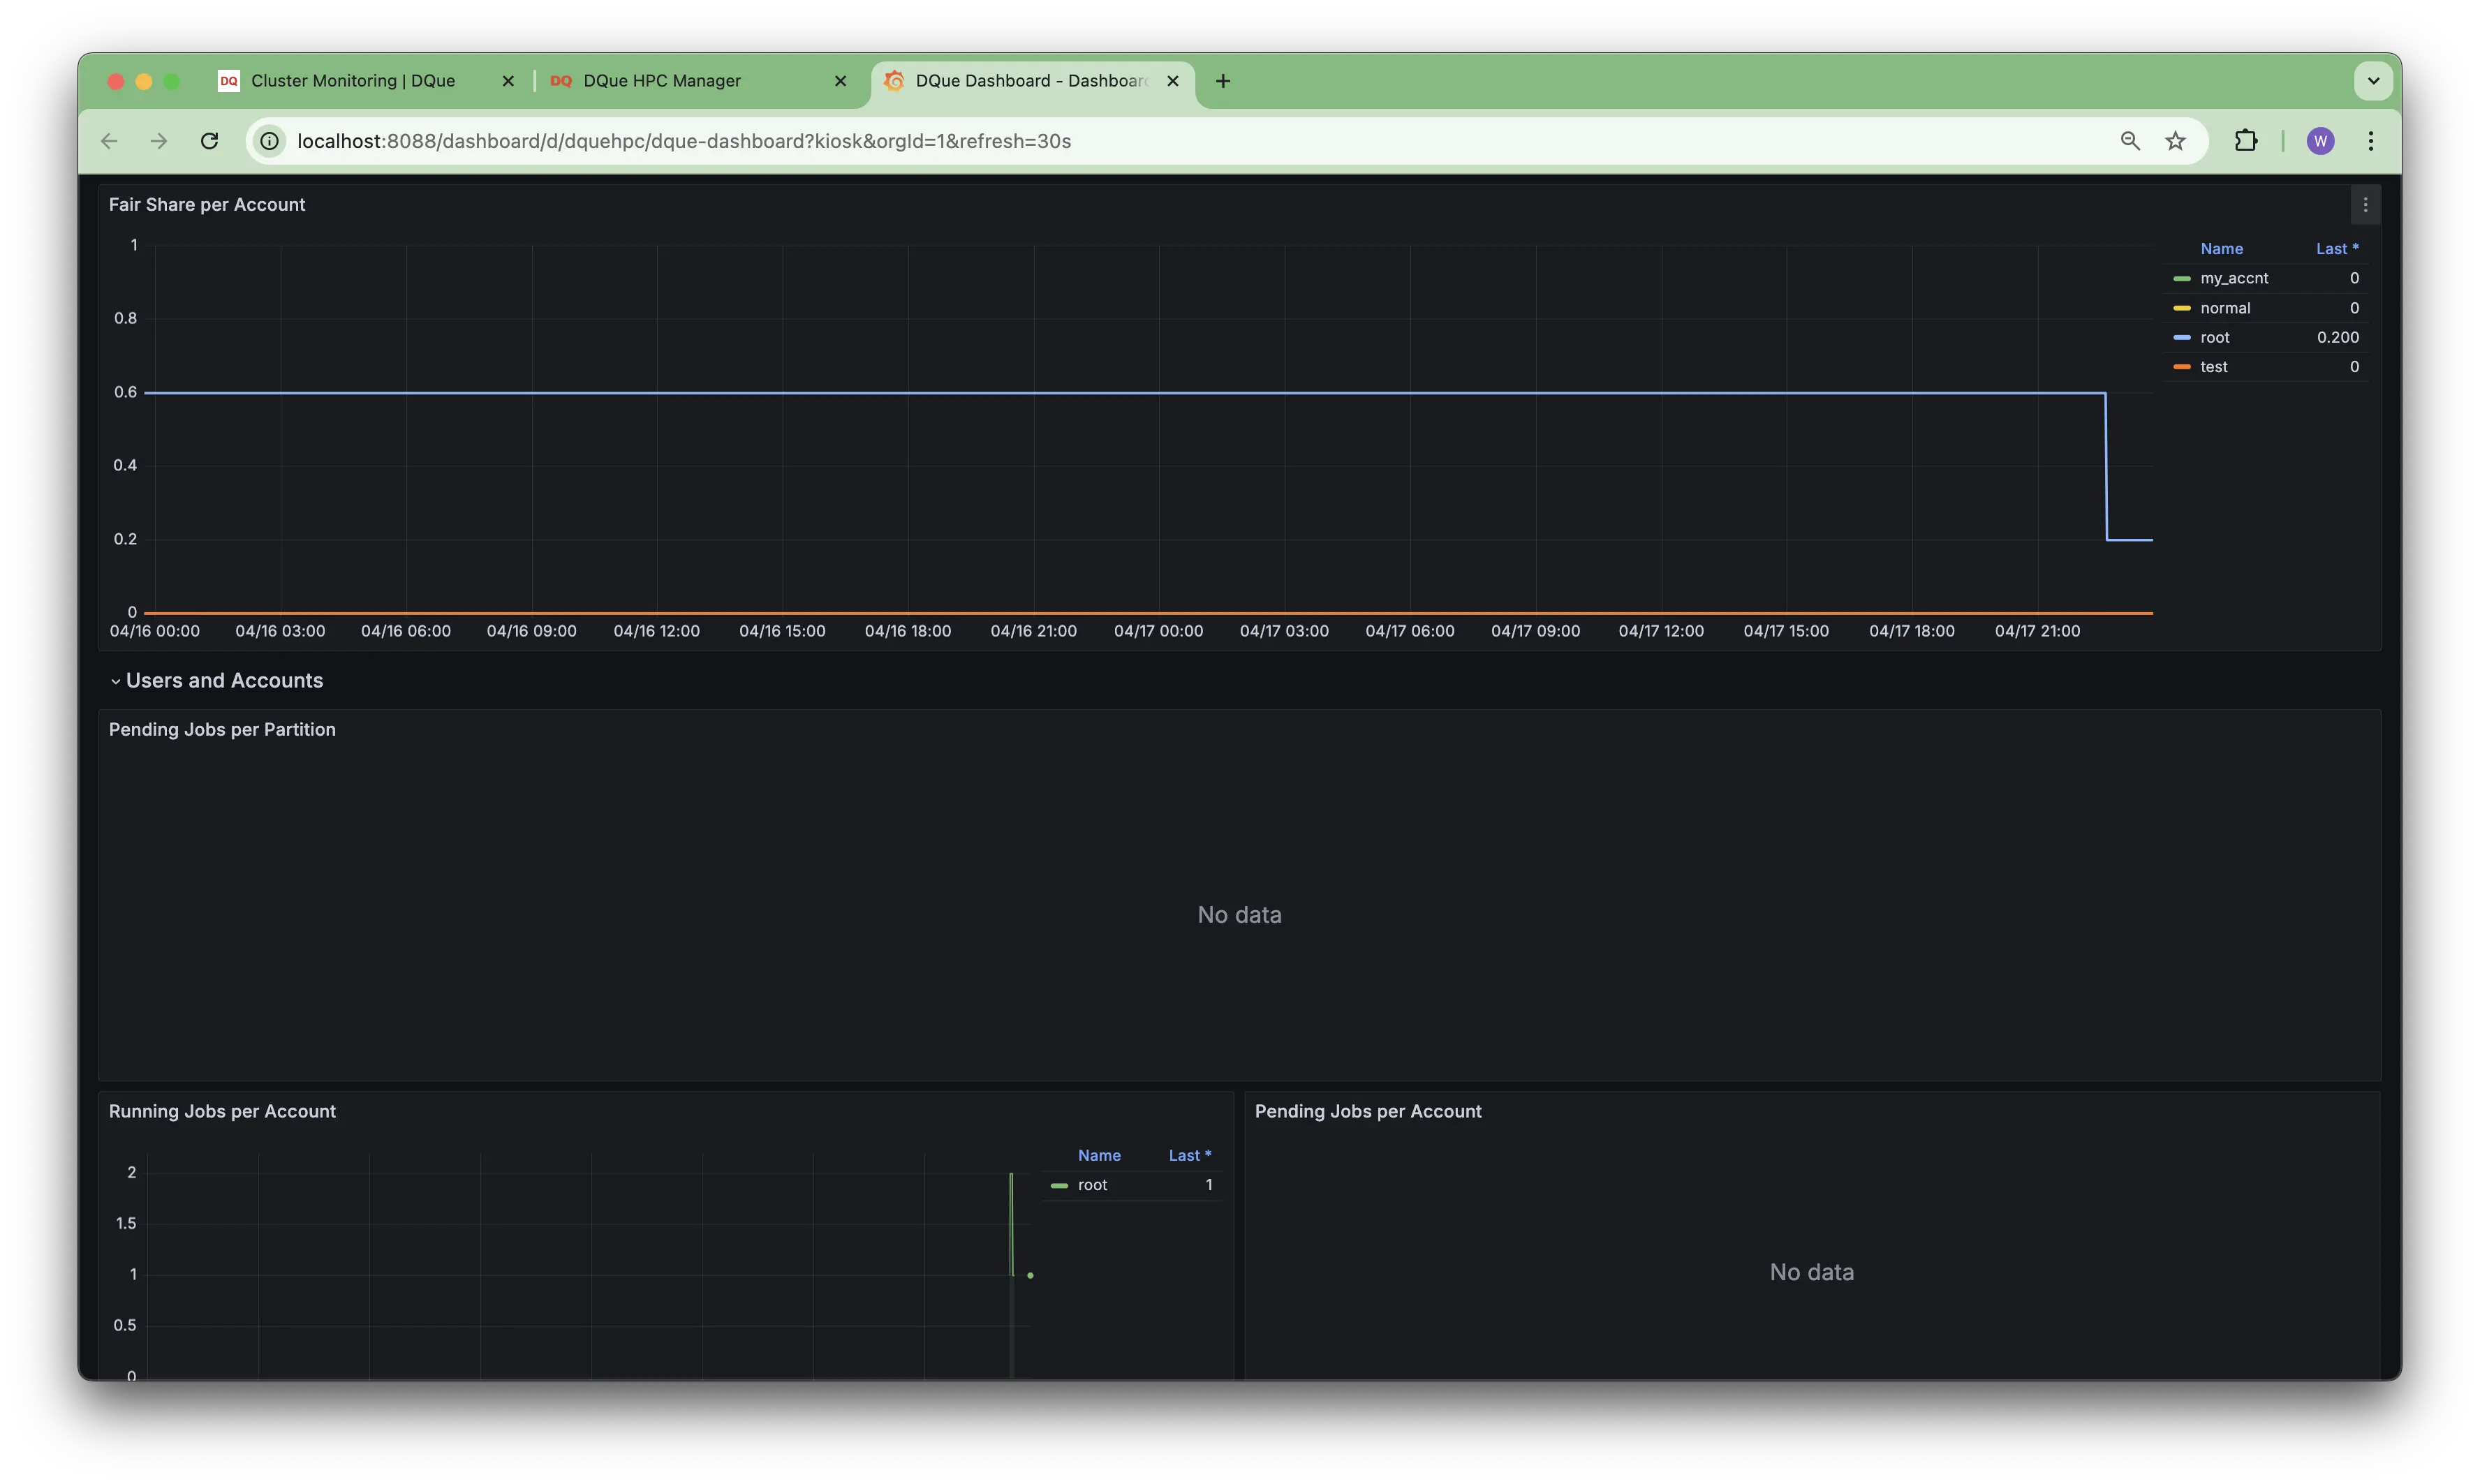
- Fair Share per Account: Monitors the Slurm fair share value for different accounts.
- Running Jobs per Account: Tracks the number of running jobs associated with each account.
- Pending Jobs per Account: Shows pending job counts per account (may show “No data” if none are pending).
- (Users and Accounts Section): (Appears empty or may show user-specific data if configured).
User & SLURM Scheduler Details
Section titled “User & SLURM Scheduler Details”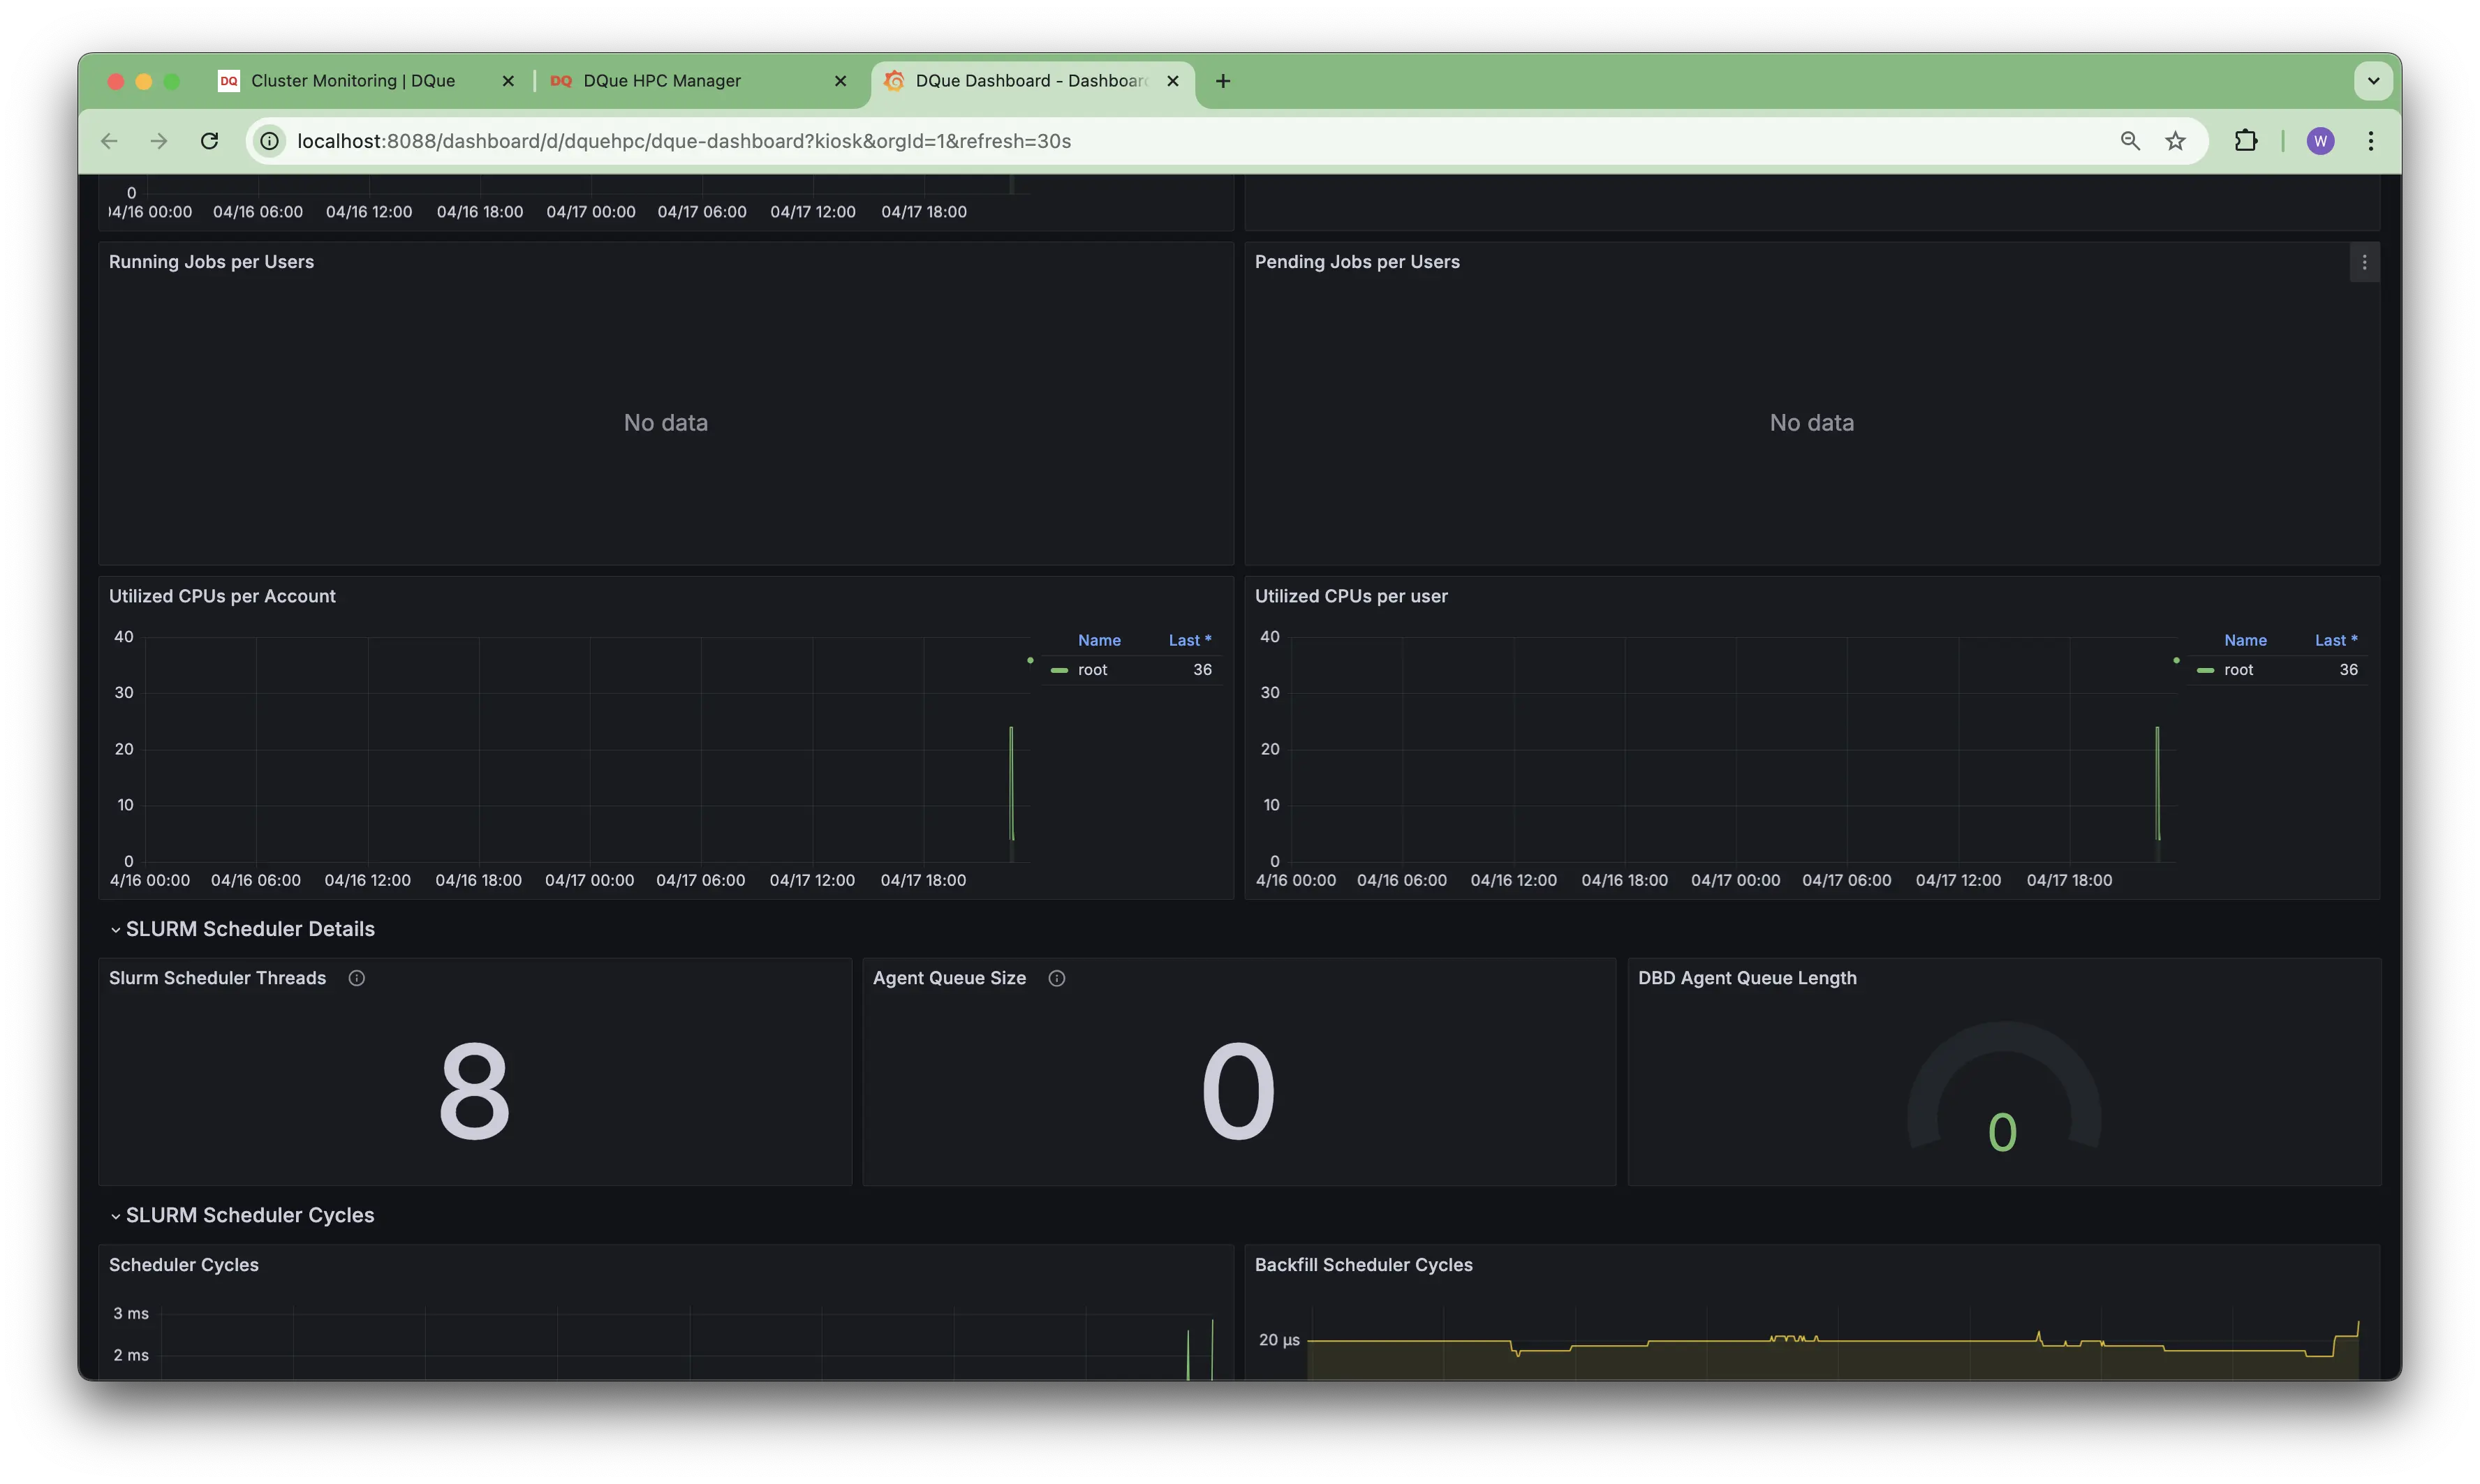
- Running/Pending Jobs per User: (May show “No data” if the selected user has no jobs in these states).
- Utilized CPUs per Account/User: Tracks CPU core usage specific to accounts or users.
- SLURM Scheduler Details: Displays internal Slurm scheduler metrics like thread count, agent queue size, and DBD agent queue length.
SLURM Scheduler Cycles & Backfill
Section titled “SLURM Scheduler Cycles & Backfill”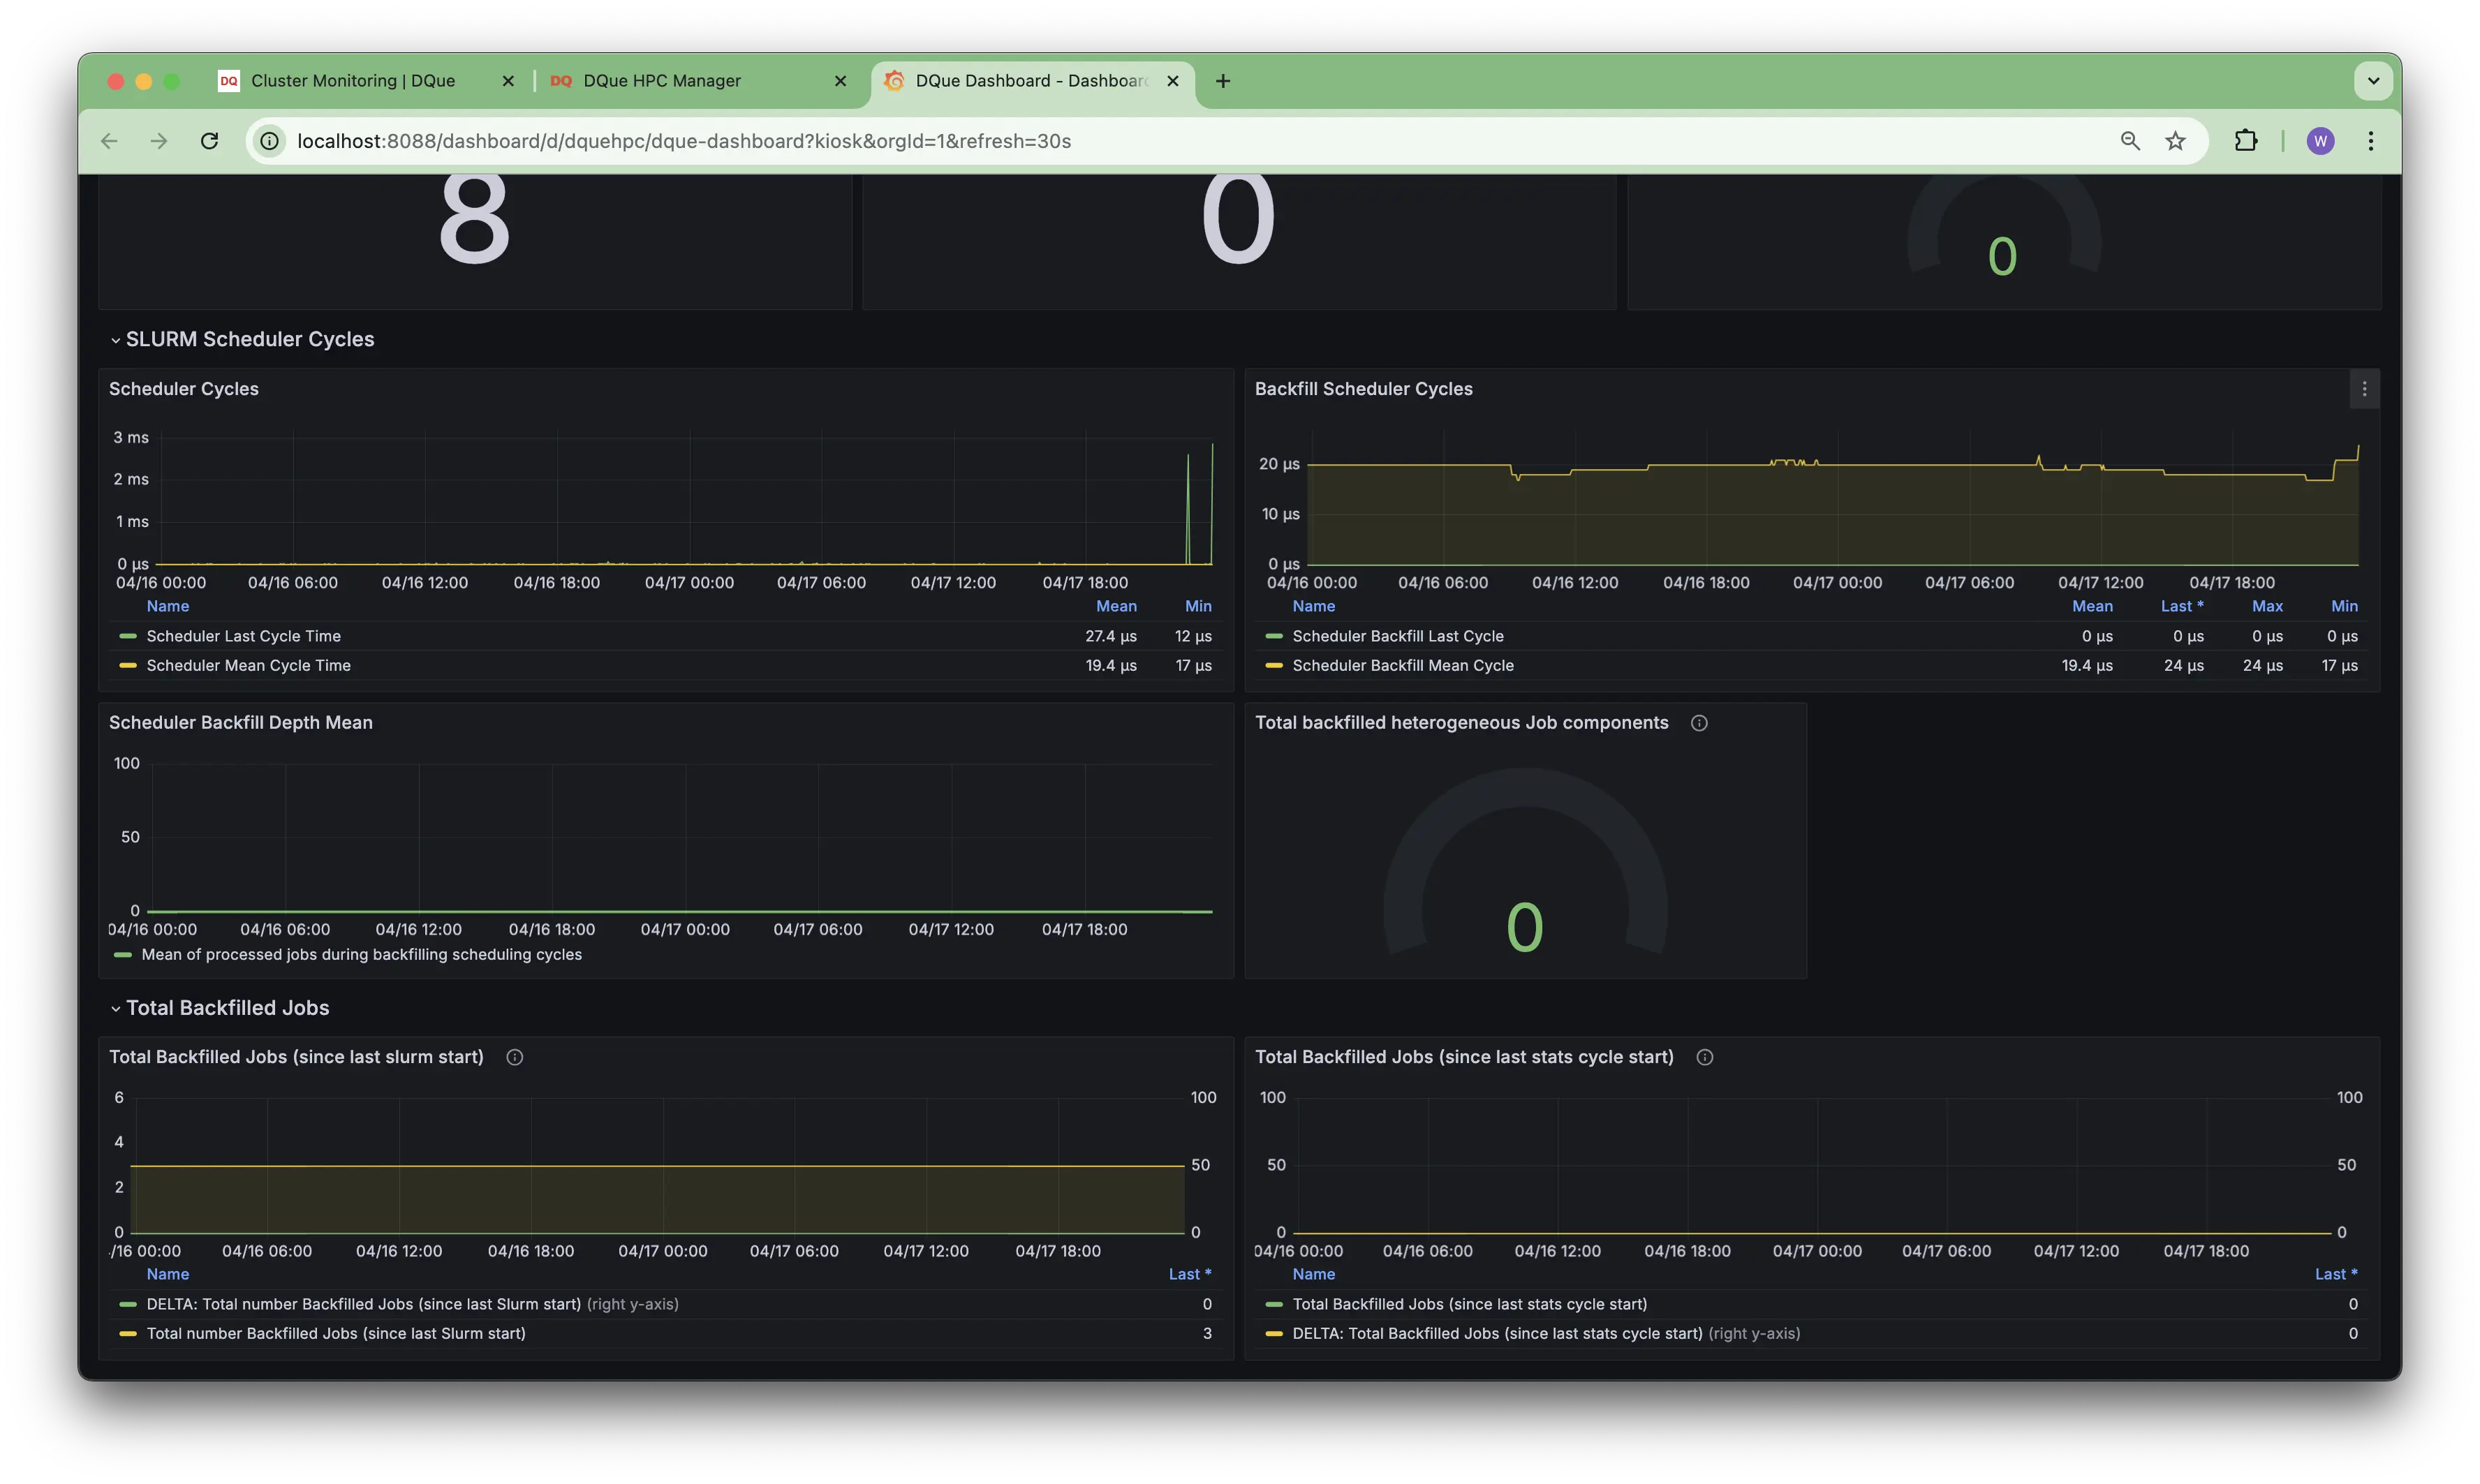
- SLURM Scheduler Cycles (Graph): Shows the duration of main scheduler cycles over time.
- Backfill Scheduler Cycles (Graph): Tracks the duration of backfill scheduler cycles.
- Scheduler Backfill Depth Mean: Monitors the average depth considered by the backfill scheduler.
- Total Backfilled Jobs (Graph & Gauge): Tracks the number of jobs started by the backfill scheduler since the last Slurm start or stats cycle reset.