Cluster Monitoring
The Cluster Monitoring feature in DQue Mobile allows you to view real-time statistics and status information about your HPC clusters directly from your mobile device.
Key Information Displayed
Section titled “Key Information Displayed”The Cluster Monitoring screen provides the following information:
Server Information
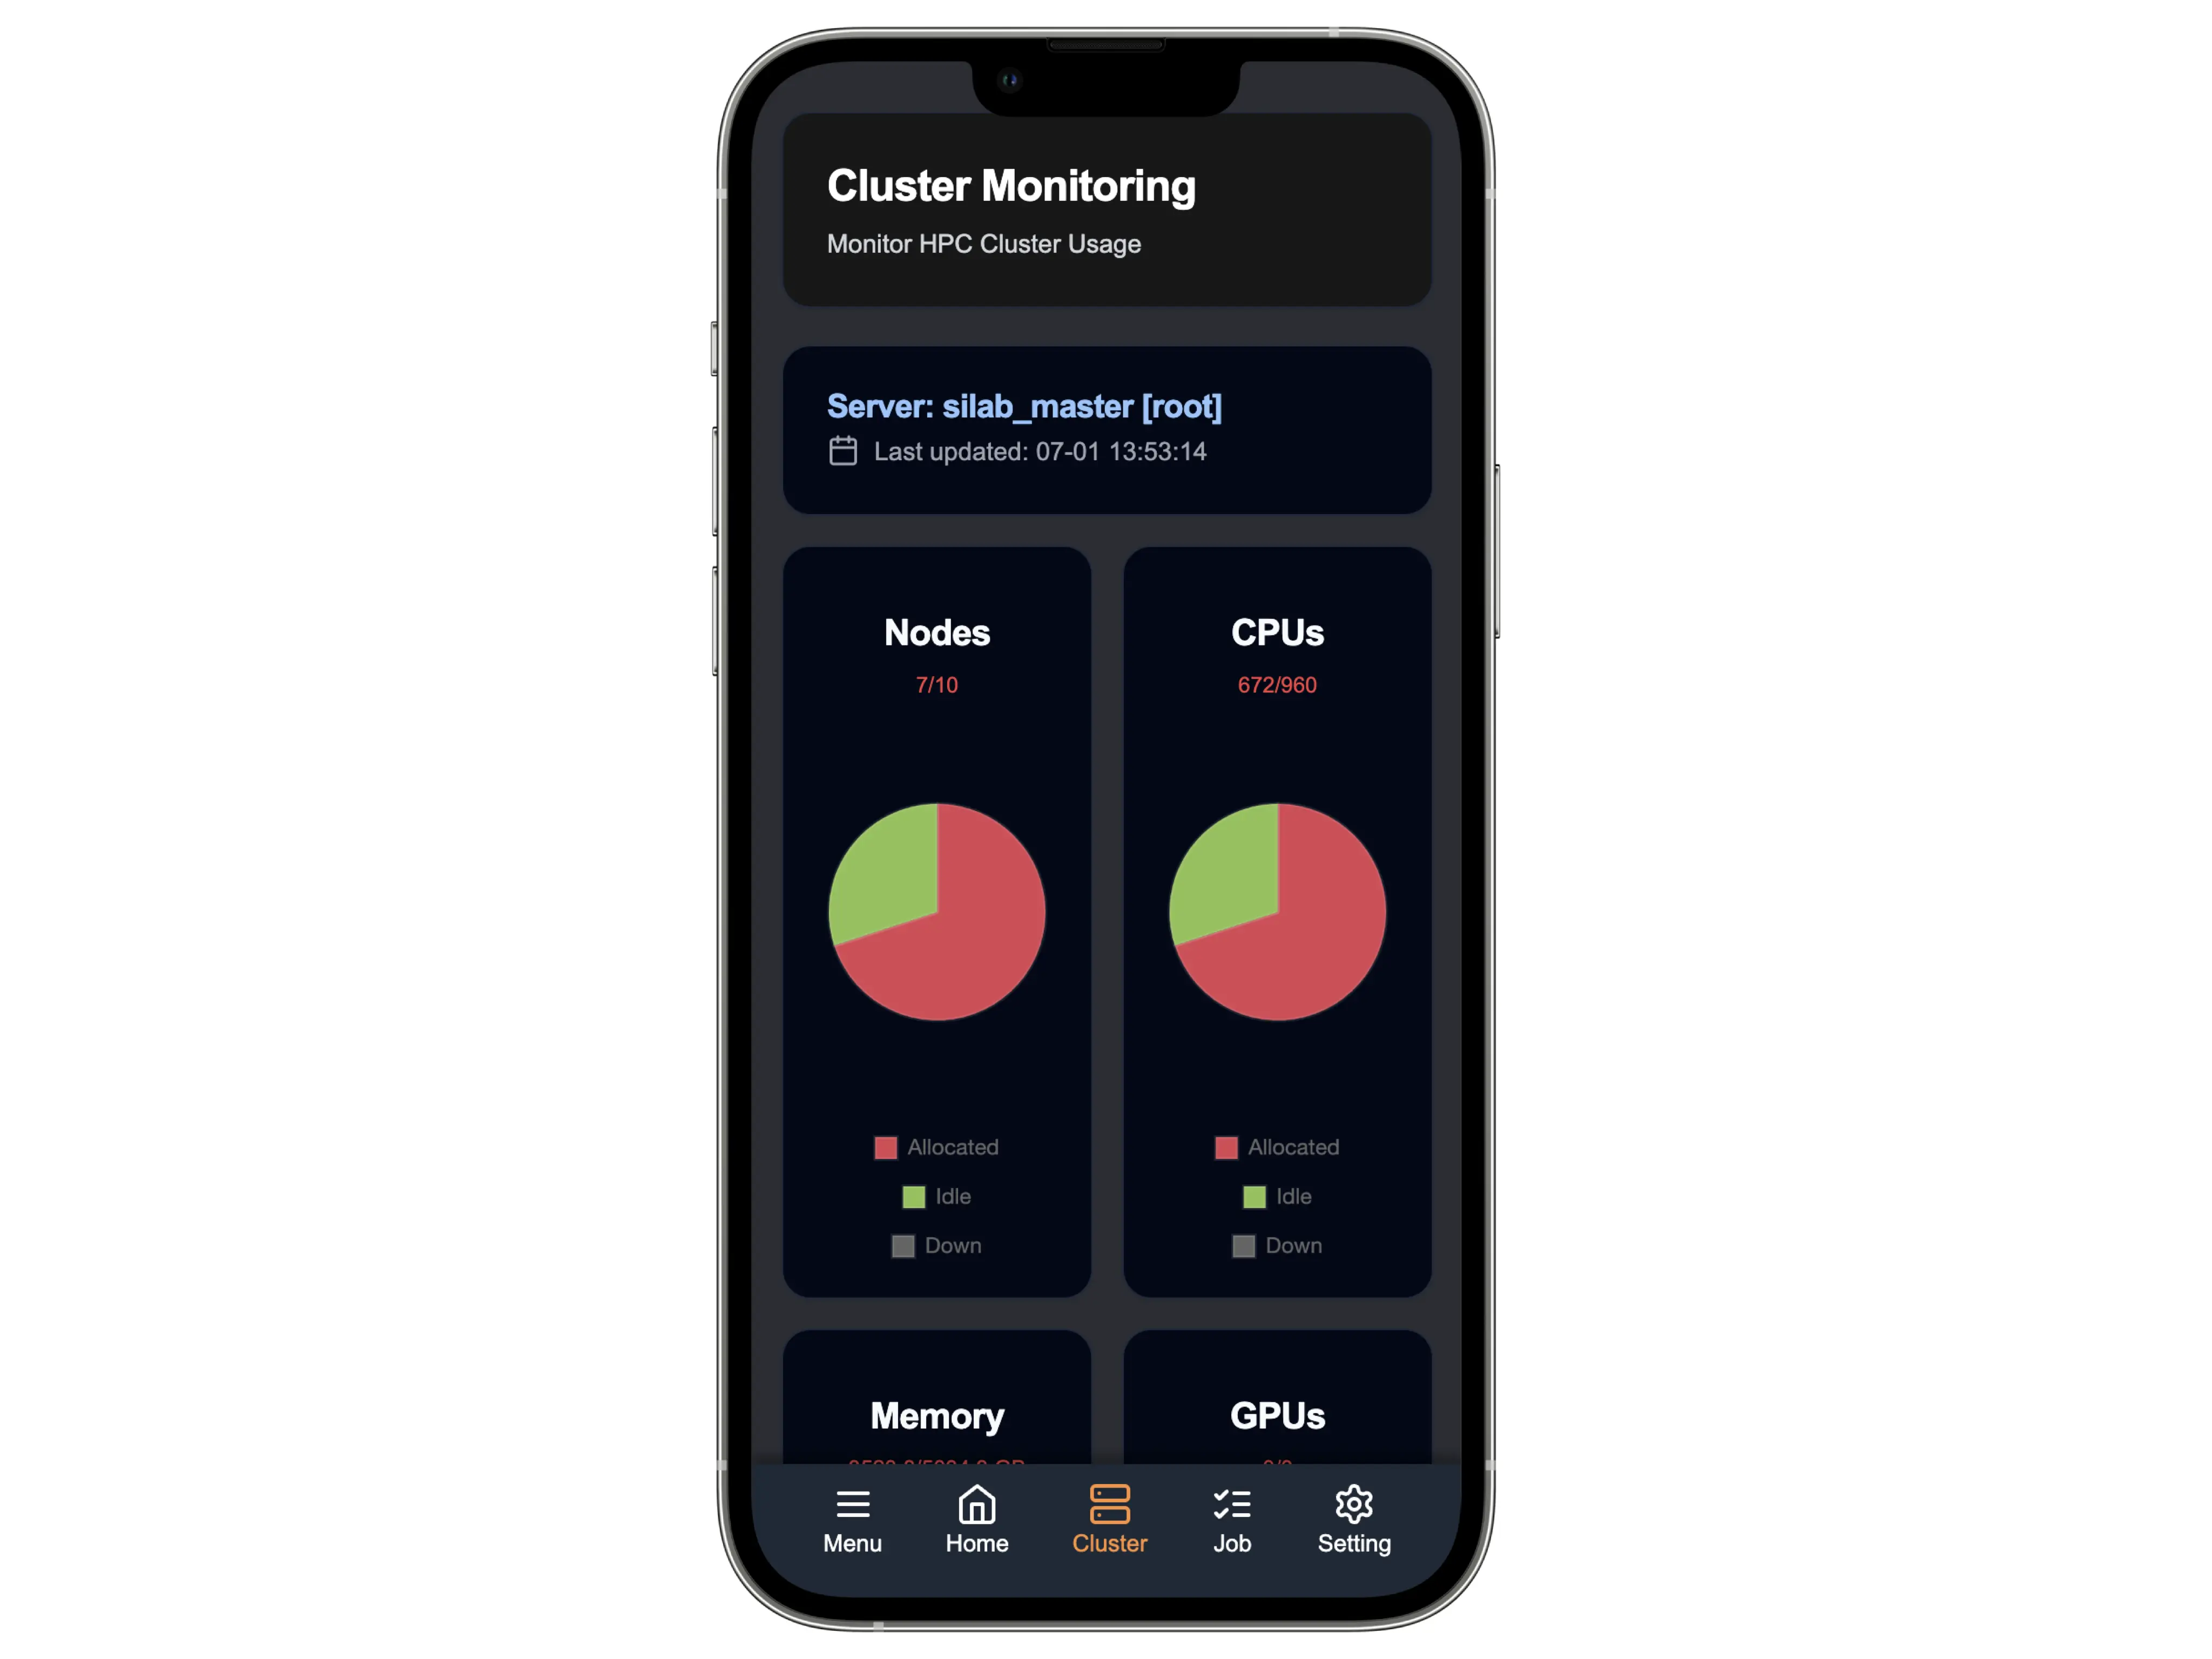
Section titled “Server Information”- Server Name: Displays the name of the HPC server you’re currently monitoring
- Last Updated: Shows when the displayed information was last updated from the server
Resource Usage Statistics
Section titled “Resource Usage Statistics”The phone view displays core resource metrics in a compact format:
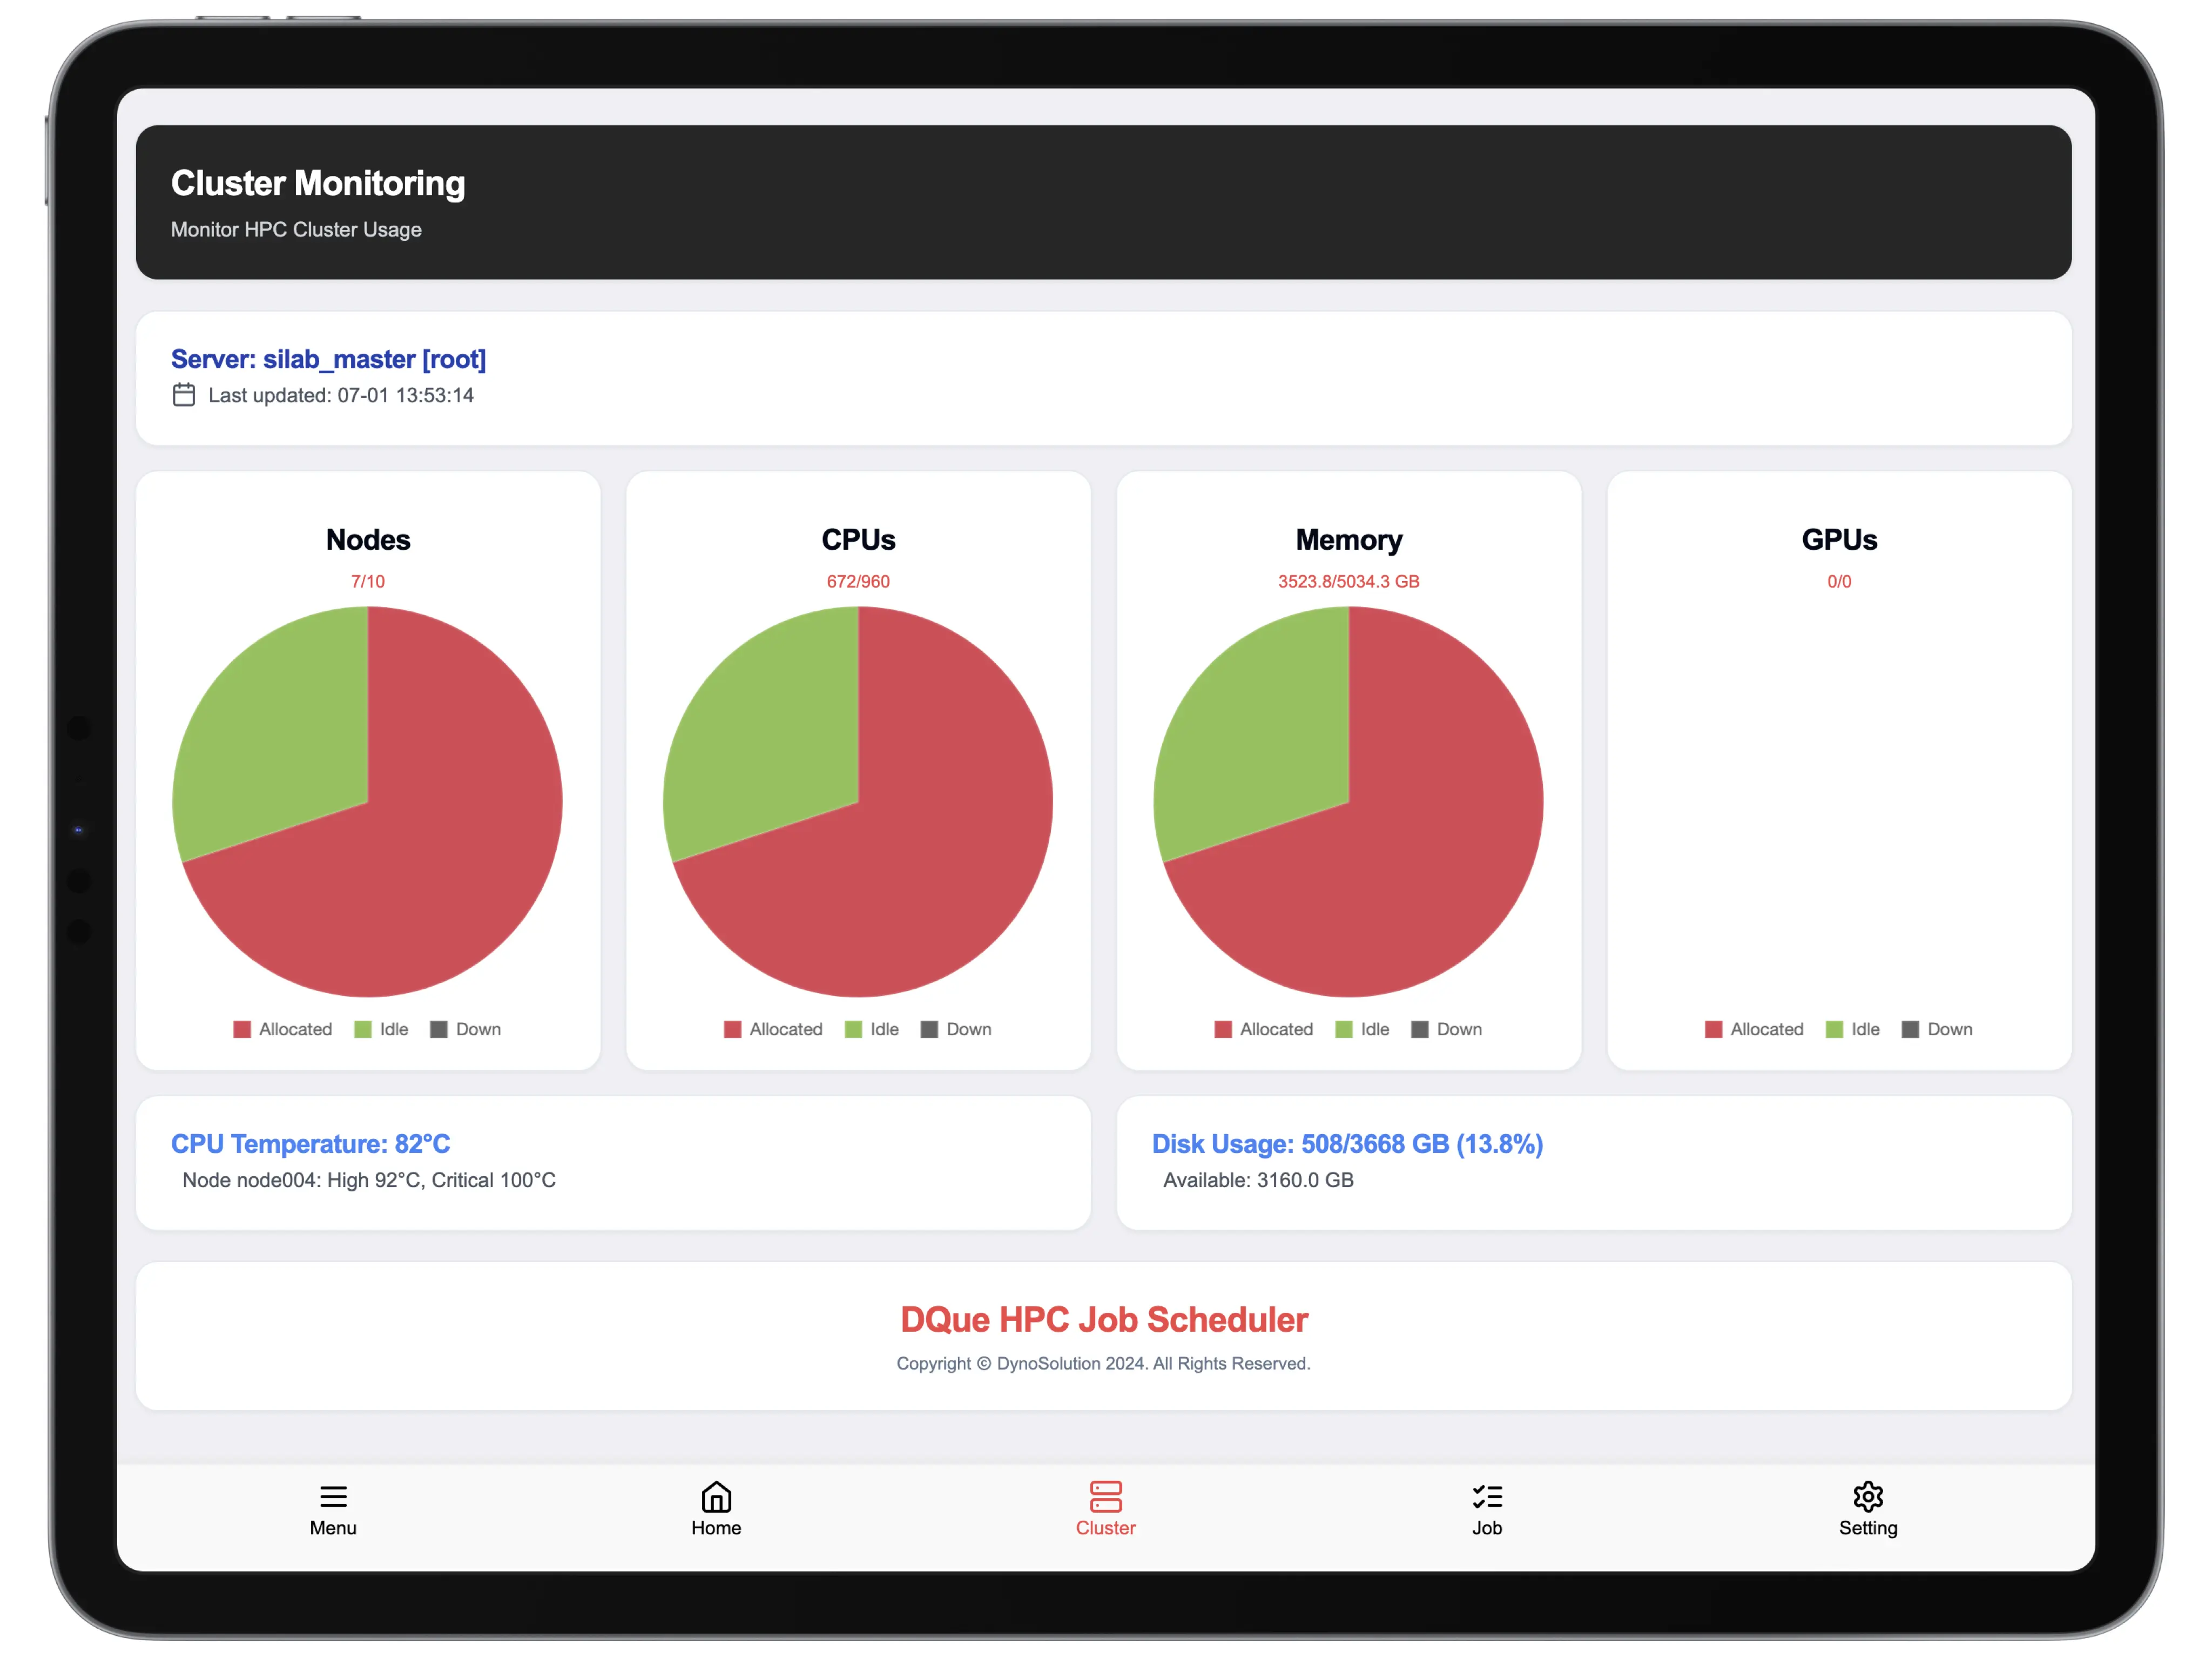
- Nodes: Shows the number of active nodes out of total available nodes (e.g., 7/10)
- CPUs: Displays CPU utilization (e.g., 672/960)
- Memory: Shows memory allocation statistics
- GPUs: Displays GPU utilization
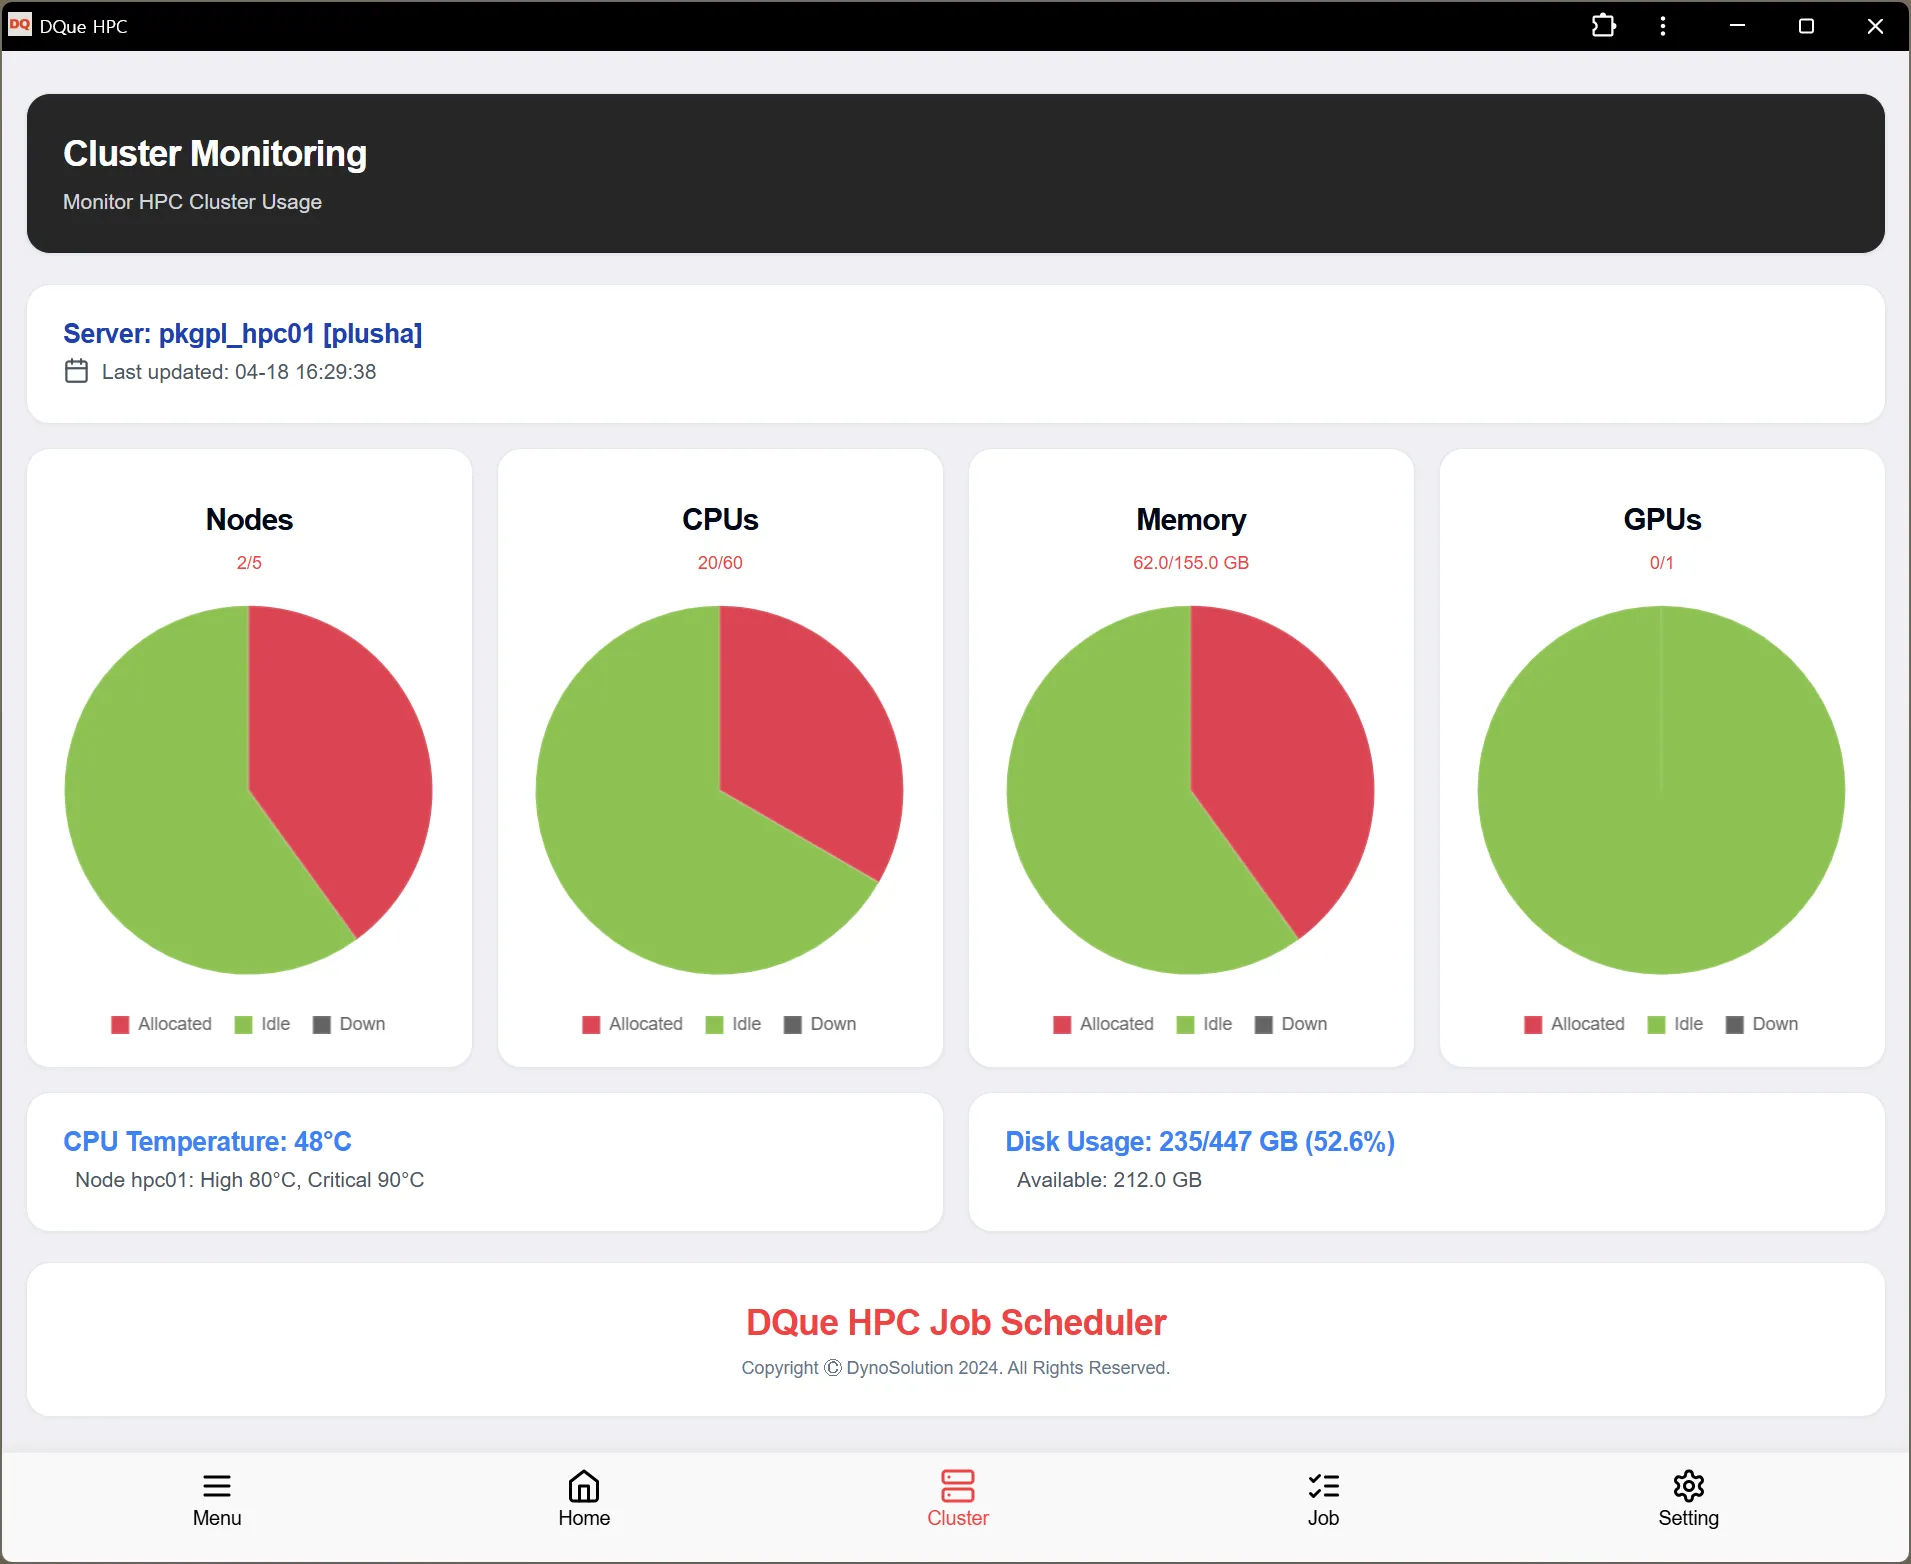
Each resource type includes a pie chart visualization showing:
- Allocated (red): Resources currently in use
- Idle (green): Available resources not in use
- Down (gray): Resources that are unavailable
Additional information:
- CPU Temperature: Current CPU temperature and critical threshold
- Disk Usage: Shows total disk space used and available storage
Navigation
Section titled “Navigation”The bottom navigation bar allows you to quickly switch between different monitoring views:
- Menu: Access application settings and options
- Home: Return to the main dashboard
- Cluster: View cluster monitoring (current screen)
- Job: Switch to job monitoring view
- Setting: Access application settings
Refresh Rate
Section titled “Refresh Rate”The cluster monitoring data automatically refreshes at regular intervals to provide up-to-date information. The last update time is shown at the top of the screen.